Figure 3.
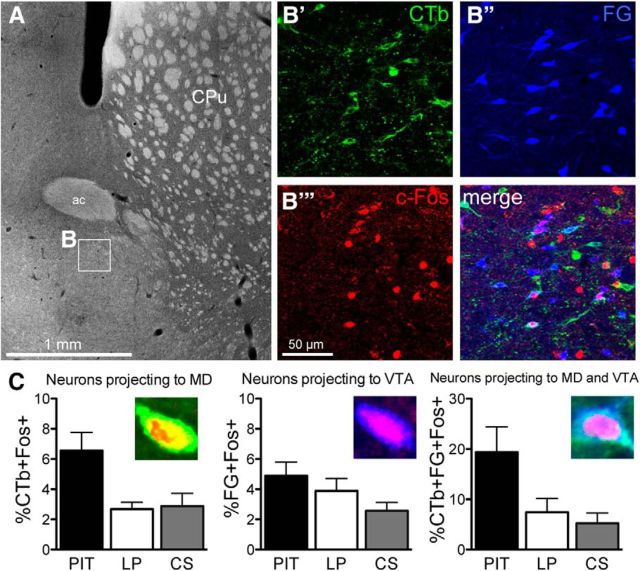
Experiment 1. Quantification of c-Fos expression of neurons in the VP-m projecting to the MD, VTA, or to both structures. A, Photomicrograph of a section containing the VP-m (inset, B). B, Immunofluorescence in the VP-m showing cells labeled for CTb (B′), FG (B′′), and c-Fos (B′′′) as well as all channels merged together. C, Percentage of neurons expressing c-Fos in Group PIT (n = 9) was higher compared with controls (Group LP, n = 10; Group CS, n = 10) in neurons projecting to the MD (Left, %CTb+Fos+) and neurons projecting to both MD and VTA (Right, %CTb+FG+Fos+). Percentage of c-Fos expression on neurons projecting to the VTA (Center, %FG+Fos+) alone did not differ between Groups PIT and LP, but was higher compared with Group CS. ac, Anterior commissure; CPu, caudate putamen.

