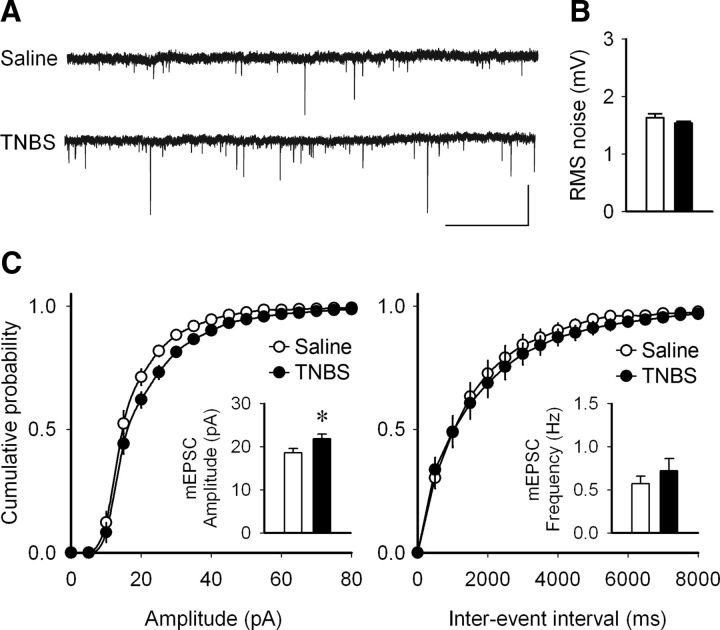
Figure 3.
Increased amplitude but not frequency of AMPA mEPSCs in pyramidal neurons of the CA1 area during peripheral inflammation. A, Sample voltage-clamp mEPSC recordings from TNBS- and saline-treated rats, 4 d after the induction of peripheral inflammation. Calibration: 5 s, 50 pA. B, No significant difference was observed in the noise level from the recordings from the two treatment groups. Data are presented as mean ± SEM of the root mean square (RMS; white bars, saline; black bars, TNBS; t test, p = 0.180. C, Cumulative probability graphs from the neurons from saline- and TNBS-treated animals. There was a significant increase the amplitude of the mEPSCs in TNBS-treated animals (left inset bar graph). Data are presented as mean ± SEM. *p = 0.046 (t test). No difference was detected in the mEPSC frequency between the two groups (right inset bar graph; t test, p = 0.382; saline, n = 8 cells, 5 rats; TNBS, n = 7 cells, 5 rats).

