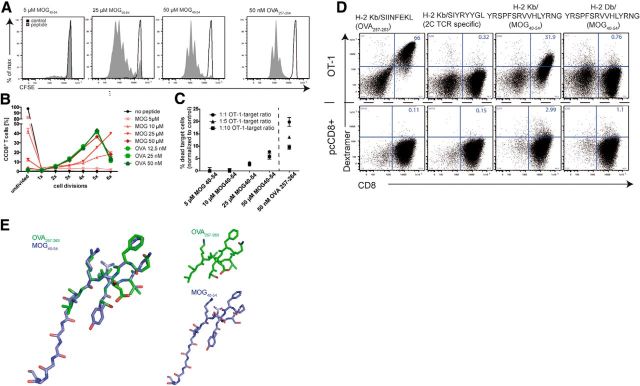
Figure 1.
Cross-recognition of the myelin peptide MOG40–54 by OT-1 T cells. A, Spleen cells of OT-1 mice were isolated, labeled with CFSE, and then stimulated with different concentrations of antigenic peptides. MOG40–54 induced concentration-dependent OT-1 T cell proliferation in this 3D CFSE proliferation assay. The presented data are representative of at least three experiments. B, Quantification of proliferation assays (as shown in A) reveals full activation, that is, comparable activation to stimulation by cognate antigen OVA257–264, of OT-1 T cells by a MOG40–54 concentration of 50 μm. C, The cytotoxic potential of MOG40–54-activated OT-1 T cells is shown by specific lysis of CFSE-labeled APCs (target cells). PI incorporation in CFSE-positive cells has been analyzed by FACS after 20 h of incubation with preactivated OT-1 T cells and the antigenic peptides; data are representative of at least two independent experiments. D, The specificity of the cross-reactivity of CD8+ OT-1 T cells is confirmed by use of MHC-I-/peptide multimers (dextramers). Specific binding of OVA257–264 and MOG40–54 is identified in the context of the MHC-I H-2Kb to OT-1 CD8+ T cells. As controls, the 2C TCR-specific dextramer (H-2Kb/SIYRYYGL) and the H-2Db/MOG40–54 multimer do not show binding to the OT-1 TCR. Polyclonal CD8+ T cells do not show specific binding of any of the multimers (bottom); data are representative of two independent experiments. E, Structural data of the peptides MOG40–54 (purple) and OVA257–264 (green) were visualized and compared with DepView/Swiss-PdbViewer (Swiss Institute of Bioinformatics), which showed steric overlap of the central parts of the molecules.

