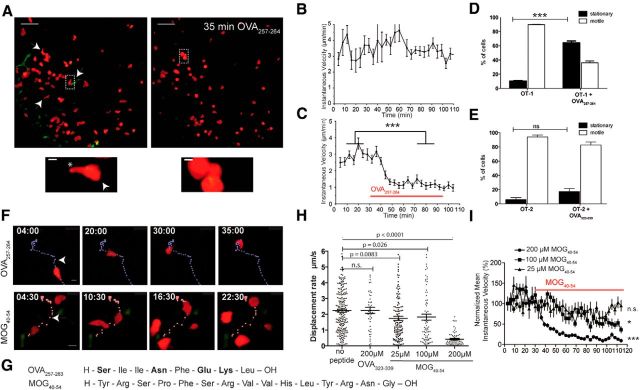
Figure 2.
OT-1 CD8+ T cells in organotypic brain slices. A, In vitro-activated OT-1 CD8+ T cells (left) in an acute hippocampal slice show continuous propulsive motility (scale bar, 100 μm), characterized by a round leading edge (arrowhead) and a trailing uropod (asterisk) as shown in magnification (scale bar, 10 μm). The addition of 25 nm OVA257–264 peptide resulted in rounding and stopping of OT-1 CD8+ T cells (A, right), a typical behavior of antigen recognizing cells. B, Quantitative analysis of mean instantaneous cell velocity reveals continuously high velocity of OT-1 CD8+ T cells in the absence of antigen (36 cells tracked, mean ± SEM). C, After application of 25 nm OVA257–264, instantaneous velocity of OT-1 T cells decreases strongly (Mann–Whitney-U test; ***p < 0.0001, 26 cells, mean ± SEM). D, Static cells among OT-1 CD8+ T cells show highly significant increases, from 10.3% to 69.4%, after OT-1 OVA257–264 application (Mann–Whitney-U test; ***p < 0.0001, mean ± SEM). E, Similar experiments with OT-2 CD4+ T cells show that OVA323–339 (CD4-OVA) application does not increase the number of stationary cells in the OT-2 CD4+ T-cell hippocampal cocultures (mean ± SEM). F, OVA257–264 application leads to rounding of the formerly ovoid and propulsive OT-1 cells. Similarly, 200 μm MOG40–54 induces a slowing down to stationary motility. Peptides were added 10 min after starting the time-lapse acquisition (start of antigen application in respect to the depicted tracks is marked with an arrowhead; scale bar, 10 μm). G, Amino acid sequence of OVA257–264 and MOG40–54. H, The stopping motility (mean displacement) induced by MOG40–54 is concentration dependent. In contrast, the control peptide (OVA323–339) does not induce motility changes (Kruskal–Wallis test; Dunn's post test). I, Mean instantaneous velocity (± SEM) of OT-1 T cells is shown for each time point and each condition compared with before application of the substance. Concentrations of 25, 100, or 200 μm MOG40–54 have been compared with the baseline in the same experiment (Mann–Whitney-U test; *p < 0.05, ***p < 0.0001). All data are representative of at least three experiments.

