Figure 4.
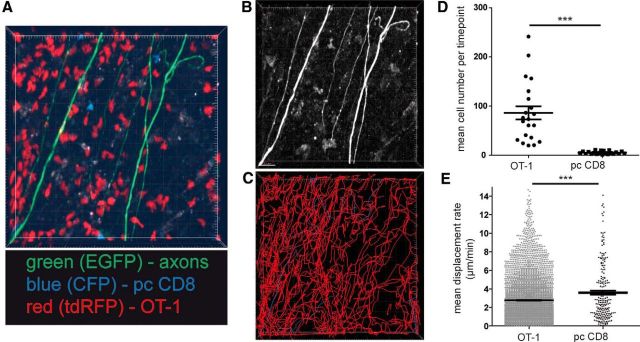
Transfer of activated OT-1 T cells into ongoing EAE. EAE was induced in Rag1−/−/thy1-EGFP mice (green fluorescent axons) by transfer of MOG35–55 TCR transgenic 2d2 CD4+ Th17 cells. Both OT-1 CD8+ T cells and control polyclonal (pc) CD8+ T cells were cotransferred 7 d after 2d2 transfer. OT-1 T cells (constitutively expressing tdRFP) and control pcCD8+ T cells (constitutively expressing CFP) had been activated in the presence of IL-12 and IL-18. For TPLSM, both CD8+ T-cell subsets were cotransferred together in recipient animals (n = 18, data representative of six experiments). A, CNS-infiltrating cells revealed red OT-1 cells and blue CFP cells with more OT-1 than pcCD8 (imaging area: 300 × 300 × 70 μm). B, High-contrast depiction of EGFP fluorescent structures (axons). C, Display of individual cell tracks (OT-1 in red, pcCD8+ in blue) of the recording as shown in A reveals complex motility pattern of OT-1 and pcCD8+ in EAE lesions (observation time 45 min). D, Mean cell numbers per time point of OT-1 or pcCD8+ T cells were analyzed for 12 time-lapse recordings from 18 recordings of six experiments. OT-1 cells strongly outnumbered pcCD8+ T cells in EAE lesions; Mann–Whitney-U test was performed; ***p < 0.0001. E, Mean displacement rate of OT-1 or pcCD8+ T cells from cell tracking analysis as shown in D are displayed. OT-1 have a lower displacement rate than pcCD8+, which indicates a higher number of antigen recognizing CD8+ T cells in the OT-1 population (Mann–Whitney-U test; ***p < 0.0001).

