Figure 5.
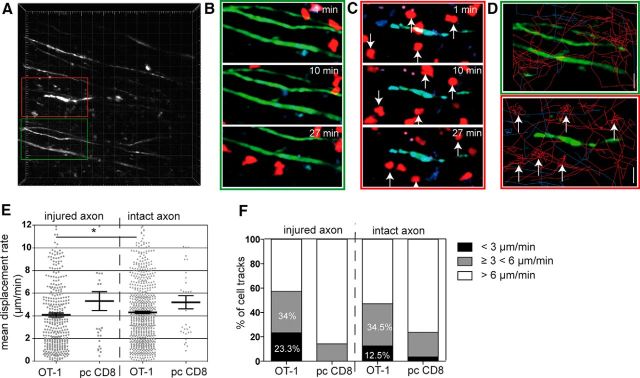
Analysis of CD8+ T-cell motility in relation to axonal injury. In the recordings, as shown in Figure 4, the interaction between OT1 or polyclonal CD8+ T cells with axons was analyzed. Some axons show typical signs of damage (swellings, fragmentation, ellipsoid bodies) due to EAE pathology; others were morphologically intact. Image areas with damaged axons (red boxed area) were compared with areas without damage (green boxed area). A, Overview high-contrast depiction of EGFP fluorescence (axons), two relevant sections are enlarged to highlight areas of axonal integrity (green frame) and axonal injury (red frame), which are found close to each other. Injured axons are characterized by focal swelling and an irregular shape of axon cross section. B, In areas of intact axons (green frame in A), both OT-1 and pcCD8+ T cells exhibit propulsive motility/morphology. C, In areas of injured axons (red frame in A), OT-1 T cells show rounding as a sign of stopping. D, Depiction of individual cell paths (OT-1: red, pcCD8+: blue) in area of intact (top) versus injured (bottom) axon(s). E, Analysis of several recordings similar to A reveals a decrease in mean displacement rate in areas of injured axons compared with intact areas (18 individual recording from six experiments, Mann–Whitney-U test; *p = 0.025). F, Analysis of mean velocity and stratification of cell tracks with stationary motility (<3 μm/min), swarming motility (≥3 and <6 μm/min), and random migration velocity (>6 μm/min) from 18 individual recordings from six experiments. The percentage of cells with the respective motility pattern is shown.

