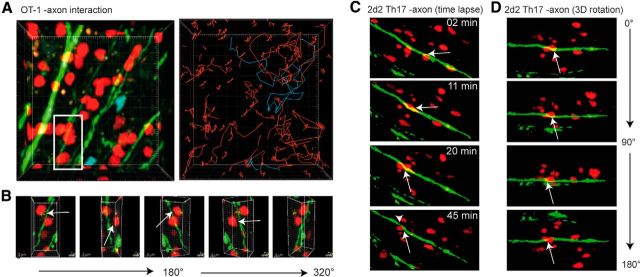
Figure 6.
Analysis of interactivity of T cells with axons. EAE was induced in Rag1−/−/thy1-EGFP mice (green fluorescent axons) by transfer of MOG35–55 TCR-transgenic 2d2 CD4+ Th17 cells. Both OT-1.tdRFP CD8+ T cells and control polyclonal (pc) CD8+ T cells (CFP) were cotransferred 7 d after 2d2 transfer. A, Area of axonal injury with numerous OT-1 T cells (red), which exhibit stationary motility; pcCD8+ T cells with free migration. Right, Analysis of cell tracks (OT-1: red, pcCD8+: blue). B, 360° rotation along the y-axis of the boxed area (white) in A. Arrows indicate the distance between axons and OT-1 C8+ T cells. C, EAE was induced in Rag1−/−/thy1-EGFP mice (green fluorescent axons) by transfer of red-fluorescent MOG35–55 TCR-transgenic 2d2.tdRFP CD4+ Th17 cells. 2d2.tdRFP Th17 cells (red, arrow) interact with axons. Axon exhibits thinning after interaction with 2d2 Th17 cell as sign of imminent dissection (arrowhead). D, Rotation along a horizontal axis of image area in C shows close proximity of axons and 2d2.tdRFP Th17 cell (arrow).

