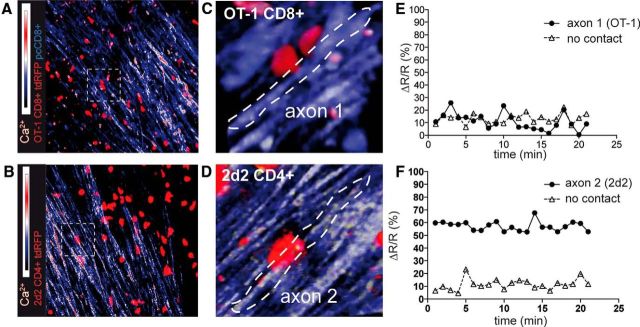
Figure 7.
In vivo intra-axonal Ca2+ evaluation to quantify axonal injury in relation to T-cell interactions. EAE was induced in Rag1−/−/thy1-TN-XXL mice (genetically encoded troponin-C based Ca2+ sensor) by transfer of MOG35–55 TCR transgenic nonfluorescent 2d2 CD4+ Th17 cells (A, C) or red fluorescent 2d2.tdRFP Th17 cells (B, D). Ca2+ levels are shown as the YFP/CFP ratio; data representative of at least three independent experiments. A, Activated, red-fluorescent OT-1.tdRFP CD8+ T cells and control polyclonal (pc.EGFP) CD8+ T cells were cotransferred 7 d after 2d2 transfer. As in Figures 4 and 5, interactions of CD8+ T cells were visualized. Intra-axonal Ca2+ is shown as the ratio channel (heat map: blue-red). Only few axon-associated OT-1.tdRFP cells were associated with increased intra-axonal Ca2+ levels. B, Disease-inducing 2d2.tdRFP Th17 cells strongly associated with high Ca2+ axons. C, 3D time-lapse imaging of the boxed area in A is shown and reveals the subtle contact formation (arrowhead) of static OT-1.tdRFP cells with axons (CFP channel: blue, YFP channel: yellow). D, 3D time-lapse imaging of the boxed area in B is shown and reveals the strong contact formation (arrowhead) of the 2d2.tdRFP cell with an axon that is tightly enwrapped by the T lymphocyte. E, 2d2.tdRFP CD4+ T cell (arrow in D) contacted axon. Mean relative Ca2+ levels in contacted axon 1 compared with control axon with no T-cell contact in the same recording. F, OT-1.tdRFP CD8+ T-cell-contacted axon 2 (arrow in C). Mean relative Ca2+ levels in the contacted axon compared with a control axon with no T-cell contact in the same recording.

