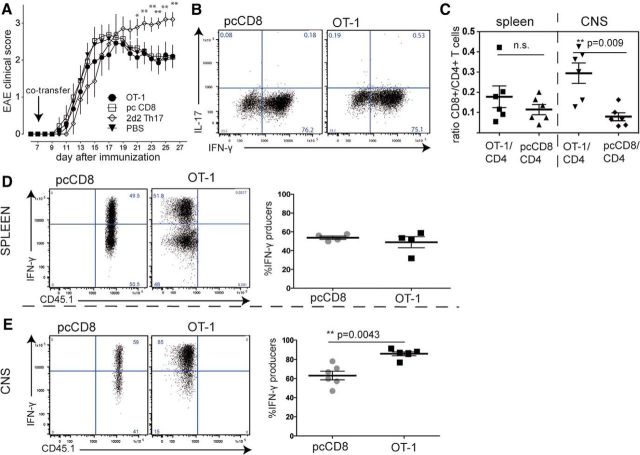
Figure 8.
Evaluation of EAE upon OT-1 T-cell transfer. EAE was induced in C57BL/6 mice by subcutaneous immunization with CFA/MOG35–55. A total of 30 × 106 activated CD8+ T cells were cotransferred on day 7 after EAE induction. A, Mean clinical score of OT-1-cotransferred, pcCD8+ T-cell-transferred, or PBS-injected mice were evaluated. There was no significant difference between the CD8+ T-cell-transferred groups and the PBS control; 2d2 Th17 induced disease exacerbation compared with PBS control and to CD8+ T-cell-transferred mice (n = 7, statistical analysis of each cell-transferred group vs PBS control by Mann–Whitney-U test; *p < 0.05, **p < 0.01). B, Cytokine expression profile of OT-1 and pcCD8+ T cells on the day of transfer into recipient animals reveals strong and comparable activation of both CD8+ T-cell populations. C, For analysis of selective enrichment, mice received both OT-1 and pcCD8+ T cells analogously to the experiments shown in Figures 4 and 5. The ratio of OT-1/CD4+ T cells was increased in the CNS compared with pcCD8+/CD4+ T cells within the CNS. These ratios were similar in the spleen. The Mann–Whitney-U test was performed. D, Spleen-isolated OT-1 T cells and polyclonal control CD8+ T cells exhibited comparable amounts of IFN-γ producers after in vitro CD3/28 restimulation. E, CNS-isolated OT-1 T cells were significantly more numerous IFN-γ producers than the pcCD8+ T cells.

