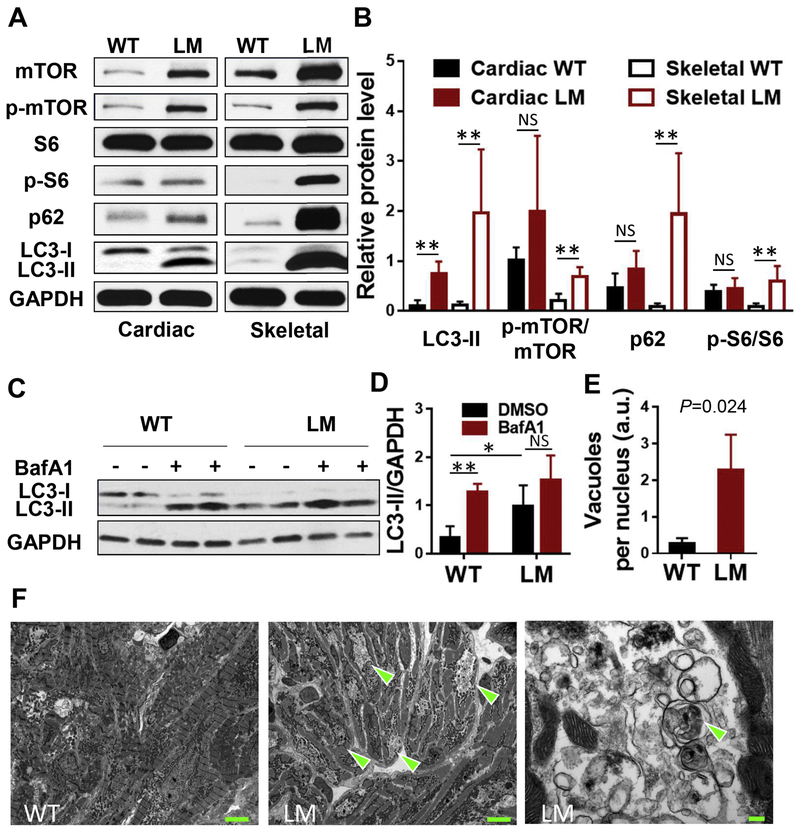
Fig. 2. Metabolic abnormalities in lamp2e2/e2.
A, B. Shown are western blots of the cardiac and skeletal muscle protein extracts suggesting increased mTOR signaling and aberrant autophagv in lamp2e2/e2 (Cardiac: N=4; Skeletal: N=5). C, D. Myocardium tissue from lamp2 mutants had higher basal level of LC3-II, and failed to further increase the level of LC3-II upon bafilomycin Al treatment (N=5). E. Quantification of autophagic vacuoles (N=3 hearts each). P<0.05 with WT, F. Representative TEM photographs of cardiac ultra-thin slices (13 months of age). Arrowheads indicate aggregations of autophagic vacuoles in lamp2e2/e2. At right panel, higher magnification revealed autophagosomes surrounded by double membranes. Scale bars: 5 μm (left and middle panel) and 200 nm (right panel). * P<0.05, **P<0.01.

