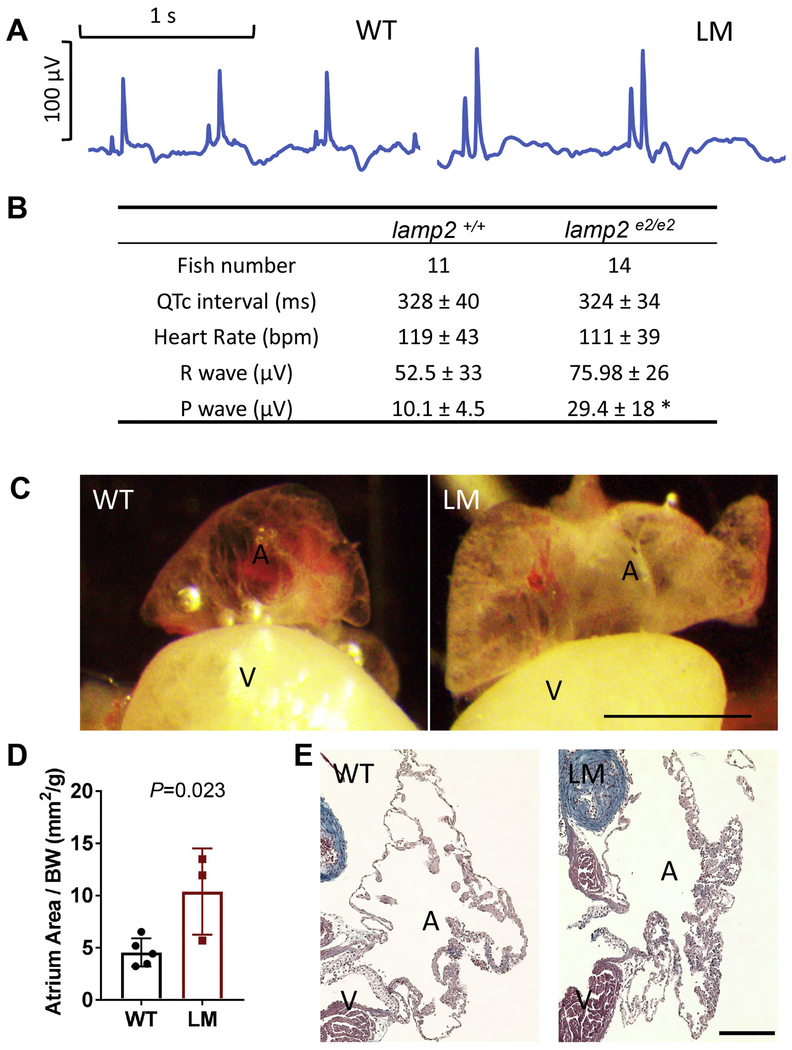
Fig. 4. Atrial hypertrophy in lamp2e2/e2.
A. Representative electrocardiograms. Note increased magnitudes of P-waves in lamp2e2/e2(LM, right panel). B. Quantification of ECG parameters: P-wave magnitude is increased (*P<0.0005.). C. Representative images of the inflated atrium. Atria in lamp2e2/e2 appear bigger and less transparent. Scale bar is 0.8 mm. D. Quantification of the area of atria averaged from two perpendicular planes and normalized by BW (N=3). E. Trichrome staining of the atrial slices. Additional trabeculae were noted in atria of lamp2e2/e2. Scale bar is 100 um.

