Figure 6.
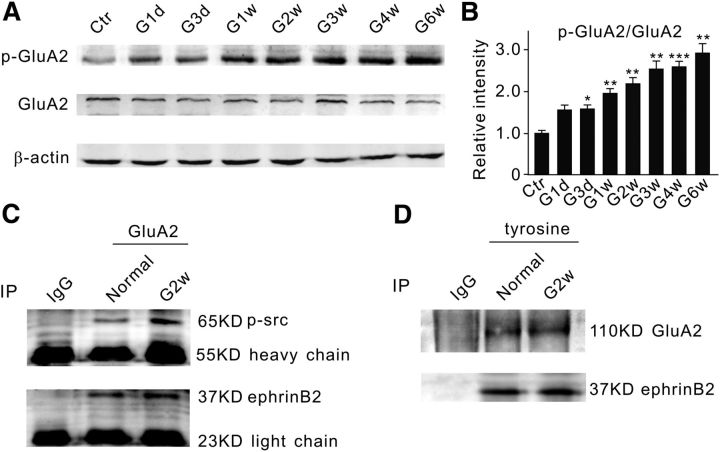
Increase in p-GluA2 protein levels in COH rat retinae. A, Representative immunoblots showing the changes in p-GluA2 and GluA2 protein expression in sham-operated (Ctr) and COH retinal extracts at different postoperational times (G1d, G3d, G1w, G2w, G3w, G4w, and G6w). B, Bar chart shows that the average p-GluA2/GluA2 ratio steadily increased with postoperational time. All of the data are normalized to Ctr. n = 6 for all groups. *p < 0.05, **p < 0.01, and ***p < 0.001 vs Ctr. C, Co-IP experiments showing the interactions between GluA2 and p-src, GluA2 and ephrinB2 in normal retinae and retinae with COH. Bands of p-src at the location corresponding to 65 kDa (top) and bands of ephrinB2 at 37 kDa (bottom) were detected in the immunoprecipitates derived using the antibody against GluA2 both in normal and COH retinal extracts (G2w). D, Co-IP experiments showing the interactions of phosphorylated tyrosine with GluA2, and with ephrinB2 in normal retinae and retinae with COH. A band of GluA2 at 110 kDa (top) and of ephrinB2 at 37 kDa (bottom) were detected in the immunoprecipitates derived using a phosphorylated antibody directly against tyrosine in both normal and COH retinal extracts.

