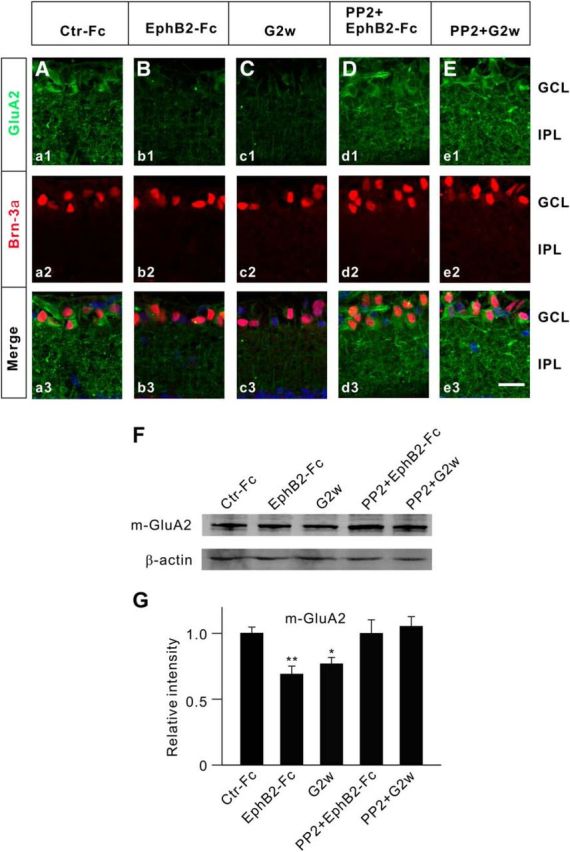
Figure 9.

Changes in membrane GluA2 protein expression in EphB2-Fc-injected retinae and retinae with COH. A–C, Immunofluorescence labeling showing GluA2 expression profiles (green) in rat retinal vertical slices taken from Ctr-Fc-injected (a1) and EphB2-Fc-injected (b1) retinae 2 weeks after the injection, and from retinae with COH in G2w (c1). a2, b2, and c2, Brn-3a-labeled images (red). a3, b3, and c3, Merged images. D, E, GluA2 expression profiles (green) in rat retinal slices taken from EphB2-Fc-injected retinae, obtained 2 weeks after the injection (Dd1), and from retinae with COH, obtained in G2w (Ee1), when these preparations were intravitreally preinjected with PP2 (100 μm, 2 μl) 3 d before the operation or EphB2-Fc injection. d2, e2, Brn-3a-labeled images (red). d3, e3, Corresponding merged images. Scale bar, 20 μm. F, Representative immunoblots showing the changes in protein levels of m-GluA2 in retinae obtained under different conditions. G, Bar chart showing the average densitometric quantification of immunoreactive bands of m-GluA2 under different conditions. Note that EphB2-Fc injection/IOP elevation induced a significant decrease in m-GluA2 protein levels; preinjection of PP2 reversed the changes. All of the data are normalized to Ctr-Fc. n = 6 for all groups. *p < 0.05 and **p < 0.01 vs Ctr-Fc.
