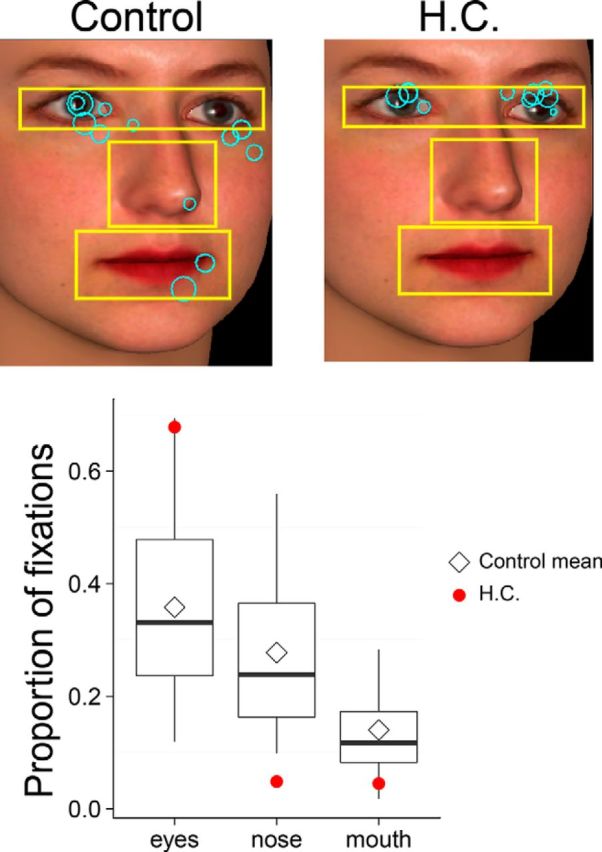
Figure 3.

Top, Example of eye fixations (teal circles) made by a representative control (left) and by H.C. (right) during the study phase. Yellow boxes depict the ROIs (eyes, nose, mouth) used for data analysis and were not displayed on the computer screen during the experiment. Bottom, Proportion of fixations directed to the individual facial features (collapsed across study blocks) for H.C. (red circle) and control participants (black box plot). H.C. directed significantly more viewing to the eyes than the control group. Box plot whiskers depict the 95% CI of the control group.
