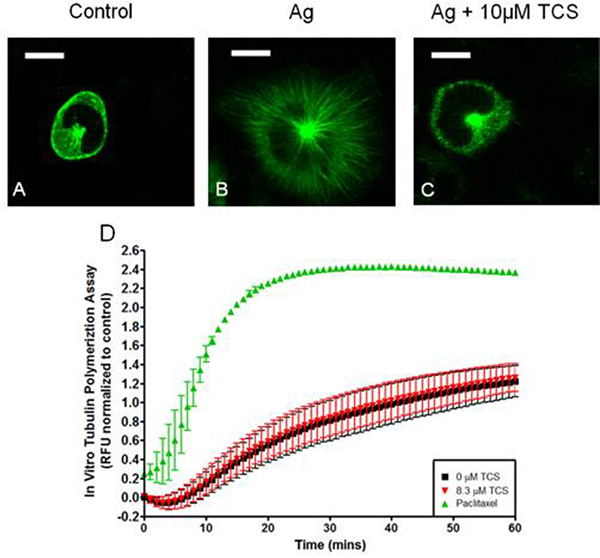
Fig. 11.
TCS effects on tubulin dynamics. Live cell confocal fluorescence microscopy of α-tubulin-EGFP transfected RBL cells (A-C). RBL cells were exposed to 0.005 μg/mL Ag (B and C) and 10 μM TCS (C) for 15 min with glucose Tyrodes-BSA, then imaged. One representative image from three independent days of imaging is shown. Scale bar, 10 μm. Time-series graph of an in vitro tubulin polymerization assay, ± 8.3 μM TCS or paclitaxel (D). Mean fluorescence intensity was determined by subtracting out the appropriate controls and normalizing to 0 μM TCS. Values presented are means ± SEM of three independent experiments with two replicates per treatment per experiment. RFU values on the y-axis correspond to fluorescence values obtained from plate reader upon tubulin polymerization.

