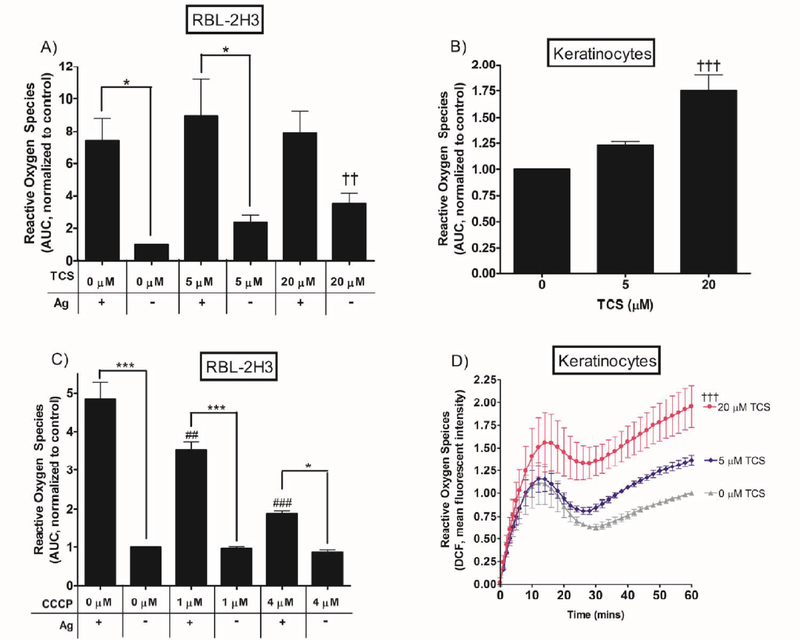
Fig. 4.
Intracellular reactive oxygen species production. ROS response was measured in RBL cells in a plate reader during stimulation with 0.01 μg/mL Ag with 0, 5, or 20 μM TCS (A) or 0, 1, or 4 μM CCCP (C) and in keratinocytes with 0, 5, or 20 μM TCS exposure only (B, D), for 1 hr in Tyrodes-BSA. For (D), mean fluorescence intensity was determined by subtracting out the appropriate controls and normalizing to 0 μM TCS. The area under the curve was obtained from raw fluorescence values corresponding to ROS levels measured over a 1 hr period via Graphpad Prism software. AUC was plotted as a bar graph, normalized to control (no Ag, no TCS). Values presented are means ± SEM of at least three independent experiments; three replicates per treatment per experiment. Statistically significant results of ± Ag within a given toxicant dose are represented by * p < 0.05, ***p < 0.001 (A, C); of Ag + no CCCP vs. Ag + CCCP by ## p < 0.01, ### p < 0.001 (C); and of no-Ag control vs. no-Ag + TCS by †† p < 0.01, ††† p < 0.001 (A, B, D), as determined by one-way ANOVA followed by Tukey’s post-hoc test.

