
Fig. 8.
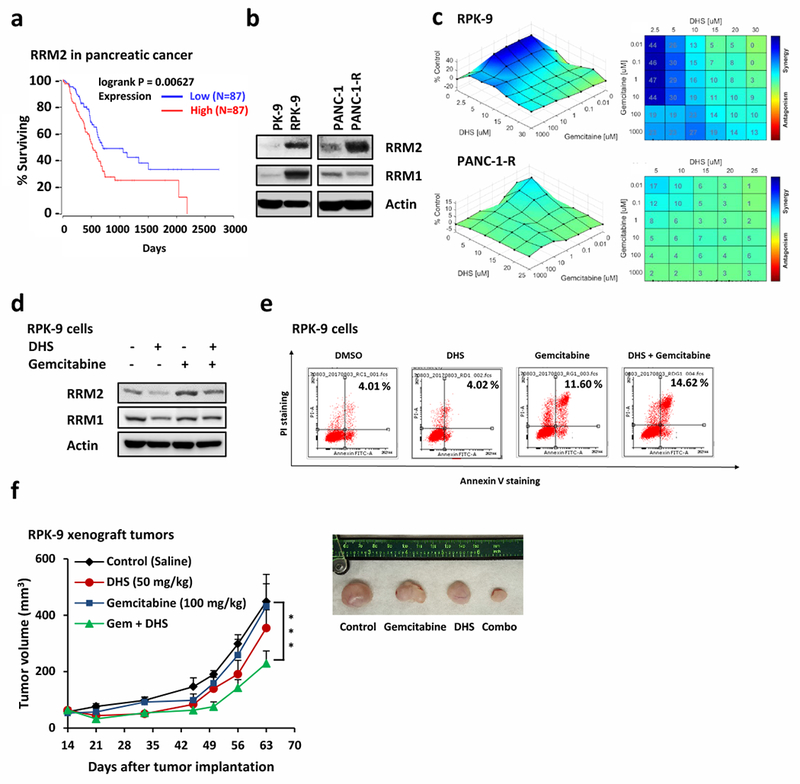
DHS overcomes gemcitabine resistance in pancreatic cancer by targeting RRM2. a Kaplan-Meier curves of overall survival rate based on clinical and molecular data for pancreatic cancer patients. The patients were stratified by the RRM2 expression levels in their tumors. Medium survival, Log-rank (Mantel-Cox) p values and hazard ratios (HR); 95 % confidence interval in parentheses) are shown. Patient information was included in Supplemental Table 2. b Western blotting to detect RRM1 and RRM2 in gemcitabine resistant lines and their parental lines (PK-9/RPK-9 and PANC-1/PANC-1-R). c Synergy assay of combined DHS with gemcitabine against RPK-9 cells (upper panel) and PANC-1-R (lower panel). d RPK-9 cells treated with DHS and/or gemcitabine were harvested for Western blotting for RRM1 and RRM2. e RPK-9 cells treated as indicated were harvested for FACS analysis to examine the apoptosis. f Growth curves of RPK-9 xenograft tumors treated with vehicle, DHS (50 mg/kg IP on days 14 to 28 and 35 to 49), gemcitabine (100 mg/kg IP on days 14, 21, 35 and 49), or DHS plus gemcitabine. Data are represented as means ± SEM, n = 6 mice/group. ***, p < 0.001 by two-way ANOVA. The lower panel is the photograph of the representative tumors from mice on day 63. Ruler scale is in cm.