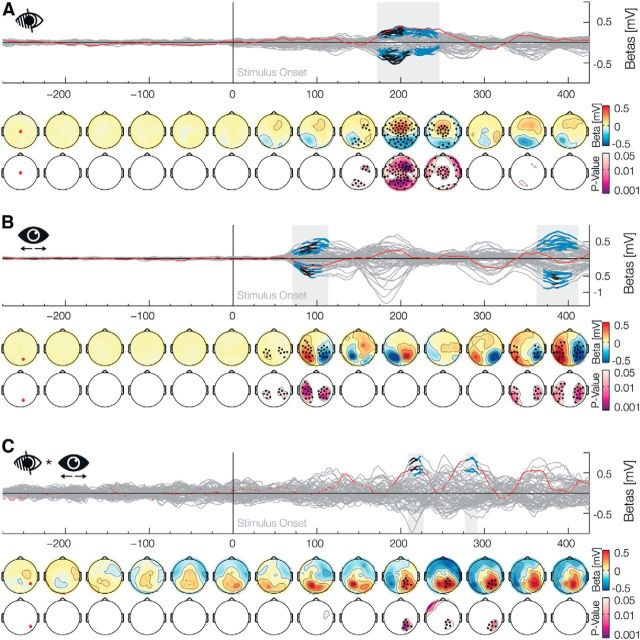
Figure 2.
Main factor blind spot. Time-series plots of the EEG β weights of the main factors or interactions for each electrode are shown (butterfly plot), aligned to the onset of the presaccadic stimulus. Blue marked latencies are significant under TFCE α of 0.05 and, therefore, are corrected for multiple comparisons over time points and electrodes. Black marked latencies are significant under additional Bonferroni correction for the testing of multiple factors in a model. This second procedure is overly conservative and only done to evaluate the robustness of the effects. The first row of the topographical plots represents the mean β weights averaged over 50 ms bins. The second row depicts the minimal TFCE-corrected p values over the same bin. Black marked electrodes represent significant channels. The location of the red highlighted channel is depicted in the first topographic plot. A, The main effect Blind spot depicts the difference of a presaccadic stimulus presentation inside and outside the blind spot, which is prominent 200 ms after stimulus onset. B, The main effect of Position shows a contralateral processing in occipital electrodes to a stimulus presented in the periphery. C, The Blind Spot × Position interaction depicts a lateral component of the effect shown in A.

