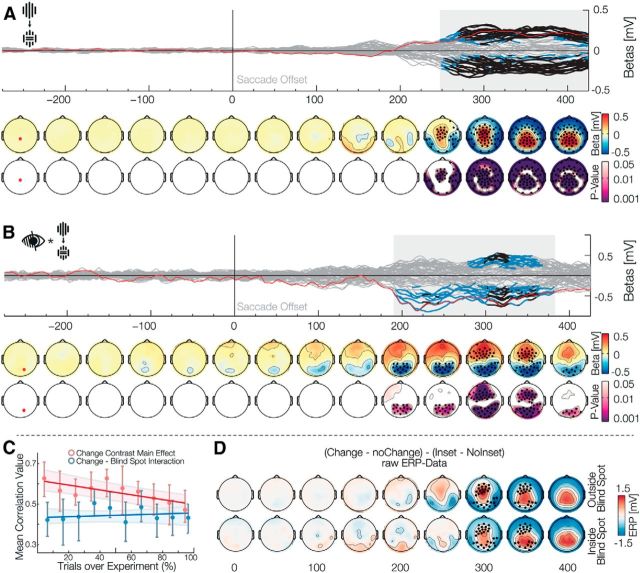
Figure 3.
Main effect of change and interaction with the blind spot. Data aligned to saccade offset when the stimulus is foveated. A, The main effect Change is shown, comparing trials in which the stimulus remained the same, with trials, where it changed during the saccade. The effect resembles a prediction error in the form of a P3. B, The interaction Blind spot × Change is shown. This shows a reduction of the prediction error described in A. C, Correlation of each subject effect-template with ERP data over 10 partitions of the experiment. The red correlation shows that the main effect of change habituates over the course of the experiment. The blue correlation shows no significant increase or decrease for the Change × Blind spot interaction and thus stays stationary over the experiment. D, Raw ERP data of the interaction depicted in B. The top row depicts outside the blind spot data and the bottom row depicts inside the blind spot data. The difference of the change effect inside blind spot against outside blind spot was tested using a bootstrapped Yuen's t test and corrected for multiple comparisons using TFCE. The significant electrodes and time-points can be seen as black dots. This confirms the reduction of the P3 inside the blind spot.

