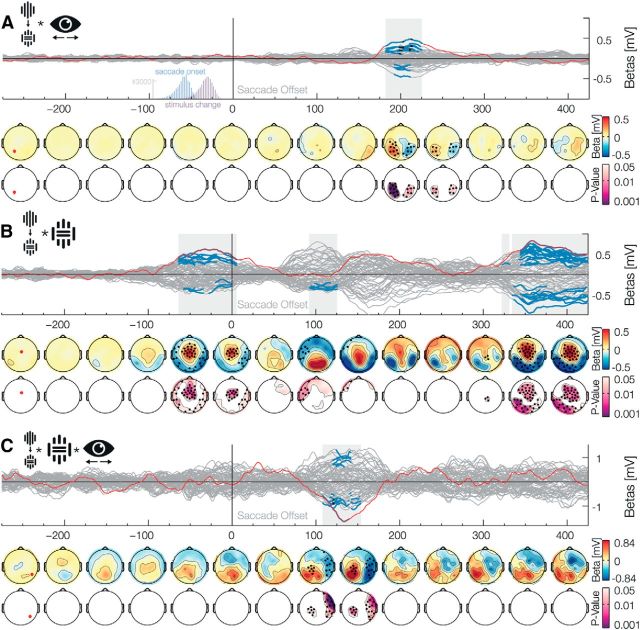
Figure 4.
Middle and early latency interaction with the change factor. Data aligned to the saccade offset when the stimulus is foveated A, The Change × Position interaction shows a clearly lateralized prediction error at ∼200 ms. The two histograms insets depict saccade onset and stimulus change, and show that all changes occurred during the saccades. B, The Change × Inset interaction shows three separate effects. Detailed descriptions are found in Results. C, The Change × Inset × Position interaction shows an early prediction error that is lateralized and also dependent on the low-level stimuli properties.

