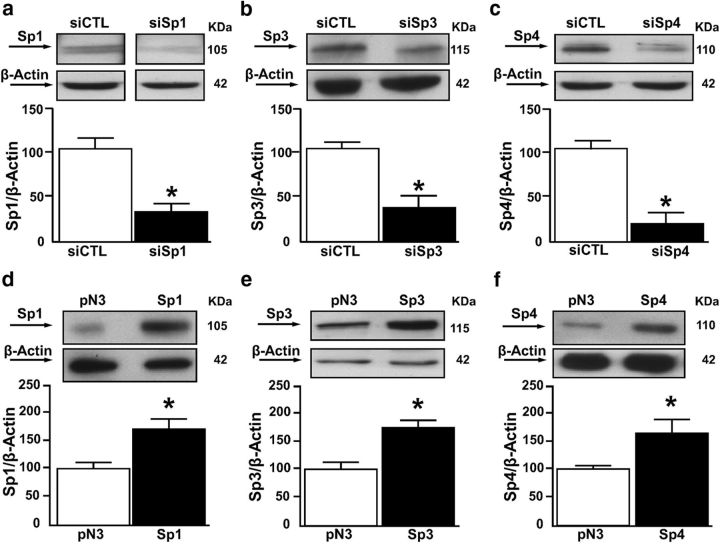
Figure 2.
Cortical neurons transfected with siRNAs or constructs for Sp1, Sp3, and Sp4. a–c, Representative WB and quantification of Sp1, Sp3, and Sp4 protein expression in neurons after treatment with siCTL, siSp1, siSp3, and siSp4. d–f, Representative WB and quantification of Sp1, Sp3, and Sp4 protein expression in neurons after transfection with empty vector (pN3), and after Sp1, Sp3, and Sp4 overexpression. Each column represents the mean ± SEM (n = 3). *p < 0.05 versus respective siCTL or pN3.

