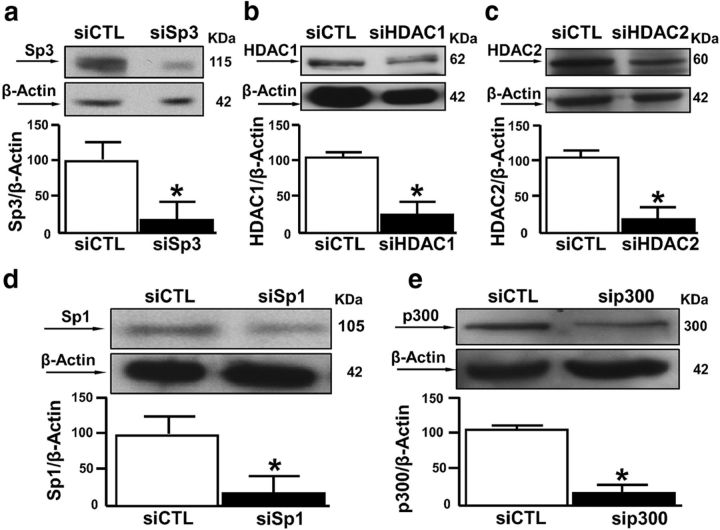
Figure 8.
Sp1, Sp3, HDAC1, HDAC2, and p300 protein expression in rat brain after siRNA treatment. a–e, Representative Western blots of Sp3, HDAC1, HDAC2, Sp1, and P300 protein levels in the temporoparietal cortex of rats intracerebroventricularly treated with siSp3, siHDAC1, siHDAC2, siSp1, and siP300. Each column represents the mean ± SEM (n = 3). *p < 0.05 versus respective siCTL.

