
Figure 1.
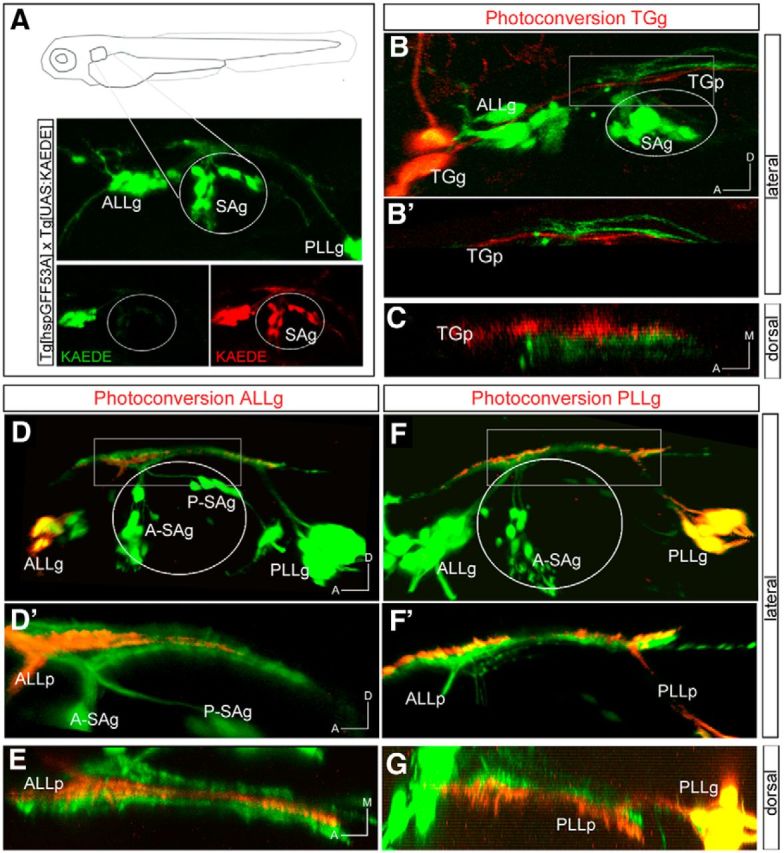
PhC of specific sensory neuronal pools in Tg[hspGFF53A]xTg[UAS:KAEDE] embryos. A, Depiction of the experiment: 48 hpf embryos expressed KAEDEGreen in sensory neurons; KAEDEGreen was photoconverted, and expression of KAEDERed in the sensory projection was assessed a few hours later. B–C, PhC of neurons from the TGg. B′, Magnification of the boxed region in B. C, Dorsal view of B′. D–E, PhC of neurons from the ALLg. D′, Magnification of the boxed region in D. E, Dorsal view of D′. F–G, PhC of neurons from the PLLg. F′, Magnification of the boxed region in F. G, Dorsal view of F′. Anterior is to the left. Axes are indicated in the figure. The contour of the otic vesicle is indicated with white circles.