
Figure 2.
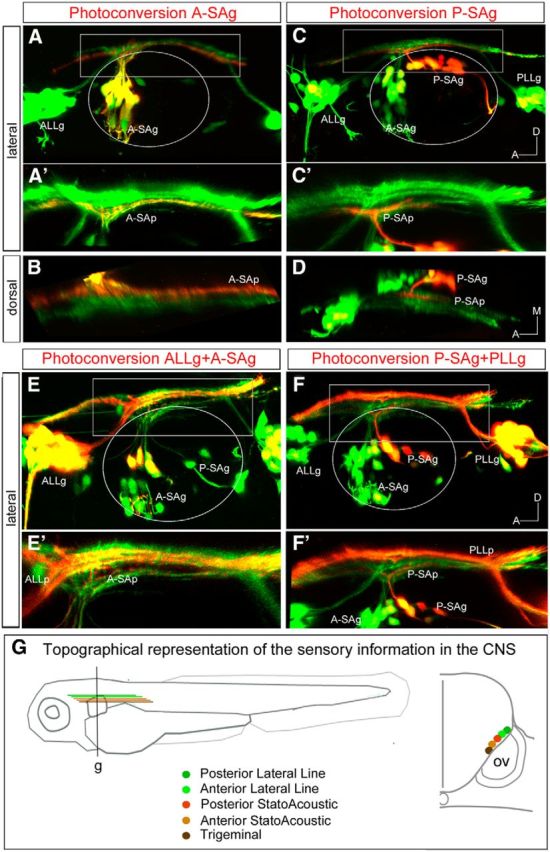
PhC of specific sensory neuronal pools in Tg[hspGFF53A]xTg[UAS:KAEDE] embryos. A–D, PhC of KAEDEGreen of neurons from the A-SAg (A–B) and P-SAg (C–D). A′, Magnification of the boxed region in A. B, Dorsal view of projections in A′. Note that red projection runs very ventral and medially, although it is not the most ventrally positioned, considering the allocation of the TGp. C′, Magnification of the boxed region in C. D, Dorsal view of projections in C′. Note that KAEDERed P-SAg projections are more dorsal and lateral than the A-SAp. E–F′, Double PhC of neurons from the ALLg and A-SAg (E, E′) and the P-SAg and PLLg (F, F′). E′, F′, Magnification of the boxed regions in E and F, respectively. G, Scheme depicting the neurosensory network with the highly ordered connectivity map, with DL/VM organization as follows: PLLg, ALLg, P-SAg, A-SAg, TGg. The right drawing represents a transverse section at the level of g. Anterior is always to the left. Axes are indicated in the figure. The contour of the otic vesicle is indicated with white circles.