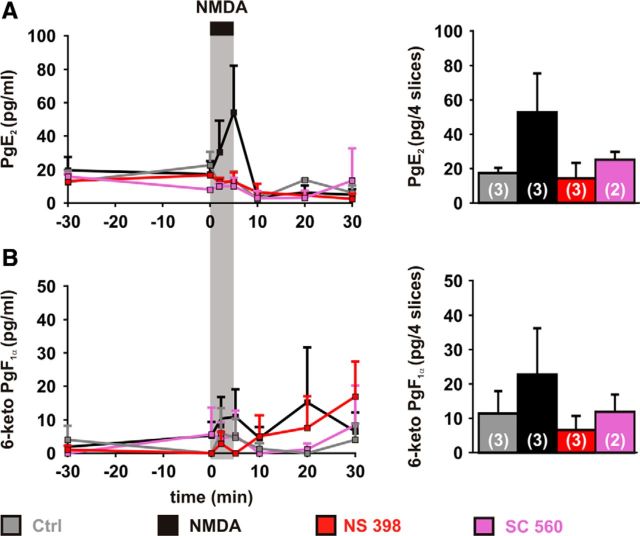
Figure 2.
Vasodilatory prostaglandins release dynamics induced by NMDA. Dynamics of PgE2 (A) and 6-keto PgF1α (B) levels in the supernatants (left) and in the slices after treatments (right). Samples were collected before adding COX inhibitors (t = −30), before (t = 0 min) and during (t = 2 and 5 min) NMDA (30 μm; black bar and vertical gray zone), and after removing NMDA (t = 10, 20 and 30 min). PgE2 (A) and to a lesser extent and 6-keto PgF1α (B) levels increased during NMDA application (NMDA, black traces) but not after NMDA removal. No change was observed when applying NMDA vehicle (water, Ctrl, gray traces) or when NMDA was applied in presence of NS 398 (red traces) or SC 560 (purple traces). Tissue content (right) in PgE2 (A) and 6-keto PgF1α (B) were elevated when slices were treated with NMDA in absence of COX inhibitor. Numbers in parenthesis represent the number of replicates. Error bars are SEM.

