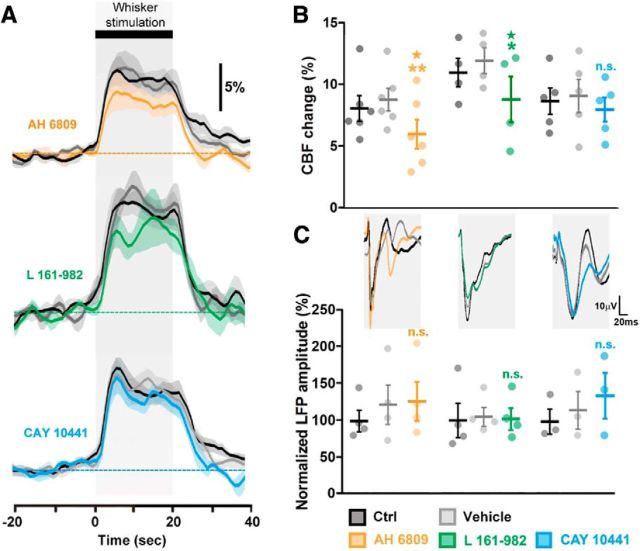
Figure 3.
Effects of EP2, EP4, and IP receptors blockade on the NVC response to sensory stimulation. A, Whisker stimulation (gray zone, top black bar) induced increases in CBF in the contralateral barrel cortex under control conditions (Ctrl; black lines). The evoked response was not altered by vehicle (gray line), whereas the EP1/EP2 receptor antagonist AH 6809 (orange, n = 6 rats) and EP4 receptor antagonist L 161–982 (green, n = 4 rats), but not the IP receptor antagonist CAY 10441 (blue, n = 5 rats), decreased this response. The SEM envelopes the mean traces. B, C, Maximal whisker-evoked changes in CBF (B) and in LFPs (C), under baseline (CBF: 8.0 ± 1.1%, 10.9 ± 1.3%, and 8.6 ± 1.2%; LFPs: 100.0 ± 16.7%, 100.0 ± 27.0%, and 100.0 ± 20.8%) and vehicle (CBF: 8.7 ± 1.0%, 11.9 ± 1.2% and 9.0 ± 1.5%; LFPs: 122.3 ± 30.8%, 105.0 ± 14.6%, and 115.4 ± 31.3%) conditions and application of AH 6809 (CBF: 5.9 ± 1.3%; LFPs: 126.6 ± 30.8, n = 6 and 4 rats, respectively), L 161–982 (CBF: 8.7 ± 2.1%; LFPs: 101.9 ± 17.0%, n = 4 rats) or CAY 10441 (CBF: 7.9 ± 1.1%; LFPs: 135.0 ± 38.4%, n = 5 and 3 rats, respectively). Whisker stimulation induced increases in the amplitude of the LFPs in the contralateral barrel cortex as shown by the representative tracings (average of 7 trials from 1 rat) for each compound (C, top). Contralateral LFP amplitudes were normalized by the mean amplitude under baseline conditions. *p < 0.05 and **p < 0.01 compared with vehicle conditions, ★p < 0.05 compared with Ctrl conditions, n.s., not statistically significant. Dots represent individual responses. Horizontal bars and error bars represent mean ± SEM.

