Figure 4.
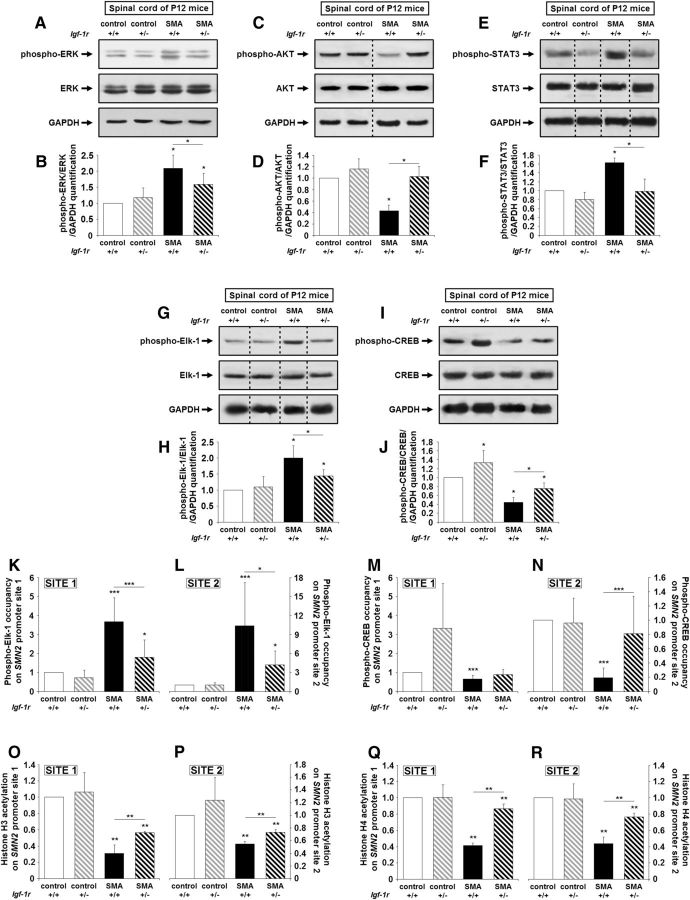
Genetic reduction of IGF-1R expression restores intracellular pathway activation profile and promotes phospho-CREB-binding on SMN2 promoter in the spinal cords of SMA mice. A, B, Western blot analysis (A) and quantification (B) of ERK protein phosphorylation in the ventral lumbar spinal cords of Igf-1r+/+ and Igf-1r+/− control mice compared with Igf-1r+/+ and Igf-1r+/− SMA mice at 12 d of age (n = 5). C, D, Western blot analysis (C) and quantification (D) of AKT protein phosphorylation in the ventral lumbar spinal cords of Igf-1r+/+ and Igf-1r+/− control mice compared with Igf-1r+/+ and Igf-1r+/− SMA mice at 12 d of age (n = 5). E, F, Western blot analysis (E) and quantification (F) of STAT3 protein phosphorylation in the ventral lumbar spinal cords of Igf-1r+/+ and Igf-1r+/− control mice compared with Igf-1r+/+ and Igf-1r+/− SMA mice at 12 d of age (n = 5). G, H, Western blot analysis (G) and quantification (H) of Elk-1 protein phosphorylation in the ventral lumbar spinal cords of Igf-1r+/+ and Igf-1r+/− control mice compared with Igf-1r+/+ and Igf-1r+/− SMA mice at 12 d of age (n = 5). I, J, Western blot analysis (I) and quantification (J) of CREB protein phosphorylation in the ventral lumbar spinal cords of Igf-1r+/+ and Igf-1r+/− control mice compared with Igf-1r+/+ and Igf-1r+/− SMA mice at 12 d of age (n = 5). K–N, ChIP analysis of phospho-Elk-1 (K, L) and phospho-CREB (M, N) in the ventral lumbar spinal cords of Igf-1r+/+ and Igf-1r+/− control mice compared with Igf-1r+/+ and Igf-1r+/− SMA mice at 12 d of age. Real-time qRT-PCR was performed to detect the SMN2 promoter site 1 (K, M) and site 2 (L, N; n = 12). O–R, ChIP analysis of Histone H3 (O, P) and H4 (Q, R) acetylation in the ventral lumbar spinal cords of Igf-1r+/+ and Igf-1r+/− control mice compared with Igf-1r+/+ and Igf-1r+/− SMA mice at 12 d of age. Real-time qRT-PCR was performed to detect SMN2 promoter site 1 (O, Q) and site 2 (P, R; n = 12). Dotted lines on Western blot images symbolize some removed interspacing lanes for a side-by-side display of samples from all groups. Data are represented as mean ± SEM and significance is reported versus Igf-1r+/+ control mice (*p < 0.05, **p < 0.01, ***p < 0.001).

