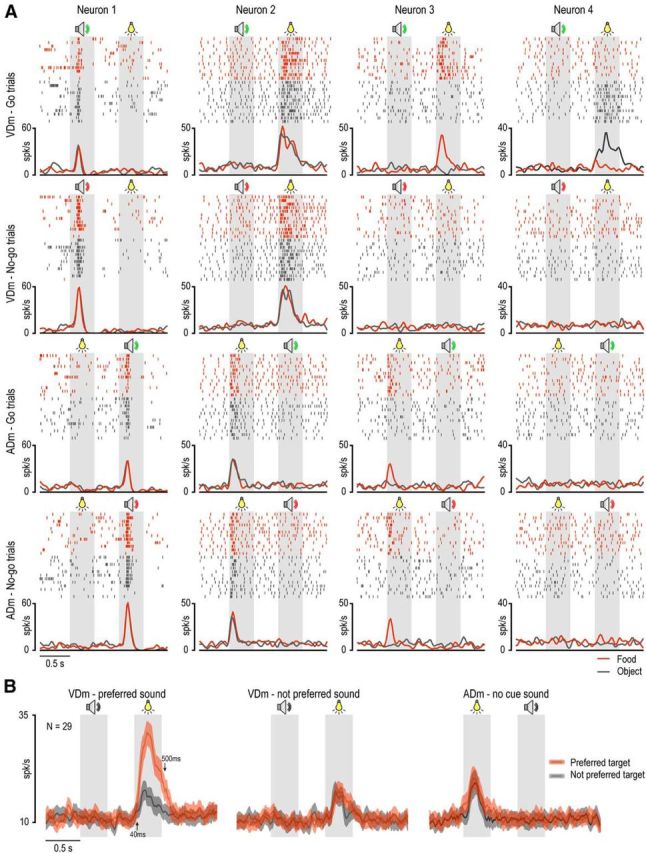
Figure 3.

Examples of sensory-driven neurons and population responses. A, Examples of four different sensory-driven neurons. Rasters and histograms are aligned on target presentation and cue sound onset, which were separated by a fixed interval of 800 ms. Rasters and histograms of single-neuron response with different targets are shown in different colors. Gray shaded areas represent the 400 ms time windows used for statistical analysis of neuronal sensory responses during (symbols): (1) target presentation (light bulb), (2) high cue tone (green speaker), and (3) low cue tone (red speaker). B, Population activity of 29 visually responsive neurons showing selectivity for both condition (go/no-go) and target. The discharge of the same neuronal population is shown during target presentation cued by the preferred and not preferred sound in the VDm, as well as before the presentation of the cue sound, in the ADm. Gray speaker symbol represents the epoch in which the cue sound was presented.
