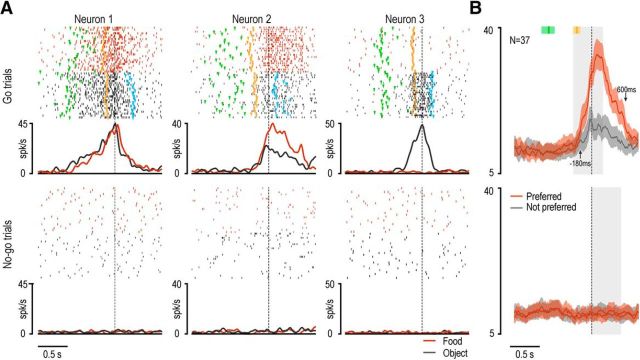
Figure 4.
Examples of motor-related neurons and population responses. A, Examples of three motor-related neurons. Rasters and histograms of go trials are aligned on the hand-target contact (grasping), whereas those of no-go trials are aligned on the no-go signal. Markers color code: green represent go signal; orange represents detachment of monkey's hand from the starting position (movement onset); light blue represents contact of the monkey's hand with the border of the jar (placing). B, Population activity of all motor-related neurons with target selectivity. Red and gray lines indicate the average discharge intensity of neurons during grasping of the preferred and not preferred target, respectively, aligned as the single neurons example in A. Colored shaded regions around each line represent 1 SEM. Gray shaded regions represent the windows used for statistical analysis of the population response. The median times of go-signal onset and movement onset are indicated with the green and orange markers, respectively, above each population plot. Shaded areas around each marker represent the 25th and 75th percentile times of other events of the same type. Black arrows indicate the time of onset (upward arrow) and end (downward arrow) of significant separation between the two compared conditions.

