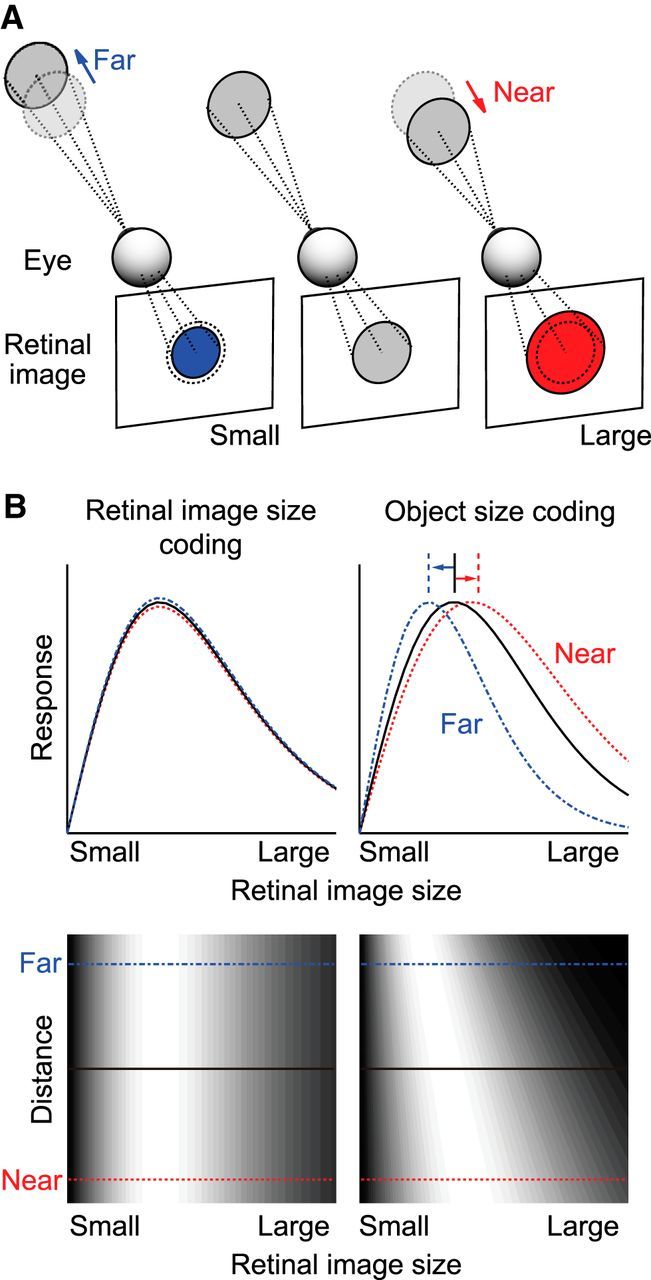
Figure 1.

Rationale of this study. A, Schematic view of the size of the retinal image projected from an object located at various distances. B, Response properties of hypothetical neurons that encode retinal image size (left) and object size (right). Top plots, Retinal image size tuning curves. Bottom plots, Discharge rates are indicated in grayscale in 2D space, where the abscissa represents retinal image size and the ordinate represents distance. Neurons that encode retinal image size should not change their tuning curves dependent on distance. Object size-coding neurons should have a preference for larger retinal images when objects are located at nearer positions, and smaller retinal images when objects are located at more distant positions.
