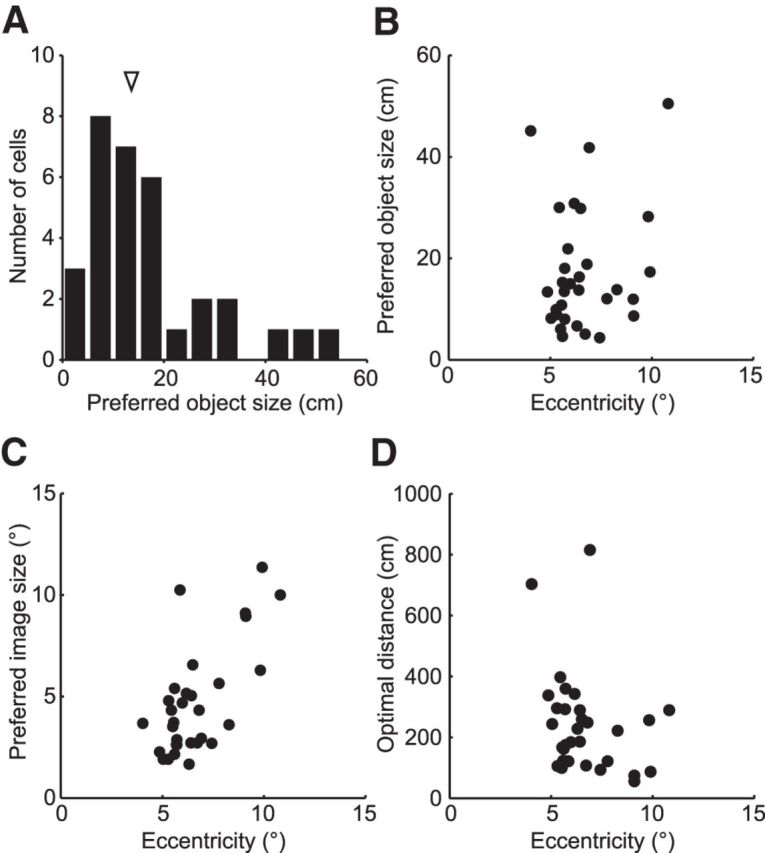
Figure 10.

Distribution of preferred object sizes. A, The distribution of preferred object sizes for 32 presumed object size-coding neurons. The arrowhead indicates the median of the preferred object size (13.6 cm). The preferred object sizes were calculated from the object size-coding neurons that showed significant scaling when calculating optimal fixation distance (Fig. 9C, filled columns). B, The relationship between the preferred object size and the RF eccentricity. There was no correlation between the preferred object size and the RF eccentricity (Spearman's rank correlation, r = 0.17, p = 0.34). C, The relationship between the preferred image size and the RF eccentricity. The preferred image size was positively correlated with the RF eccentricity (Spearman's rank correlation, r = 0.51, p = 0.0027). D, The relationship between the optimal fixation distance and the RF eccentricity. There was no correlation between the optimal fixation distance and the RF eccentricity (Spearman's rank correlation, r = −0.31, p = 0.086).
