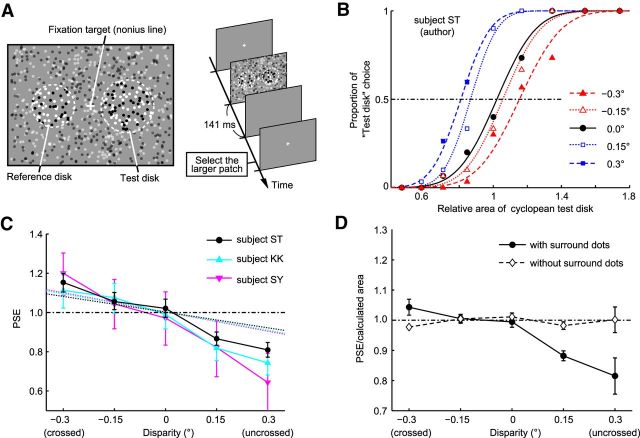
Figure 3.
Effects of perceived depth on size perception in human subjects. A, The stimulus and the time course of events in the psychophysical experiments. B, Example psychometric curves from one subject (author S.T.). The proportion of test-disk choice is plotted as a function of the area of the test disk relative to the reference disk. The cumulative Gaussian functions were fitted to the data points. The points where the curves crossed the 50% choice line are referred to as PSEs. C, Systematic change of PSEs with binocular disparity (data from an author and two naive subjects). Dashed lines indicate the geometrically calculated relationship between relative image size and binocular disparity for each subject. Error bars indicate 95% confidence intervals. D, The ratio of PSE to the geometrically calculated image area. When the stimuli did not have surrounding uncorrelated dots (i.e., the contour of the disk was visible with one eye), the calculated ratio was ∼1 for all disparities tested. When the stimulus had surrounding dots, the ratio was <1 for the uncrossed disparity condition. Error bars indicate SEM.

