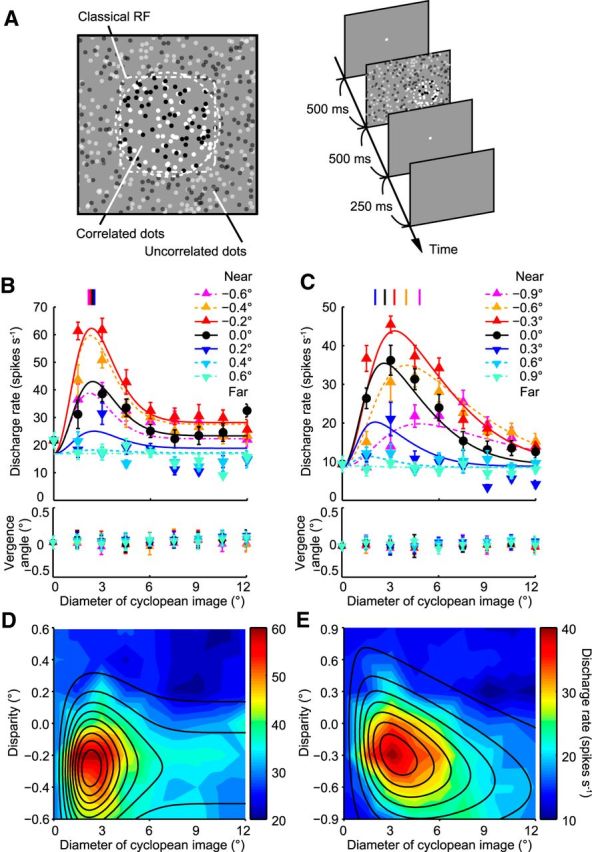
Figure 4.

Effects of binocular disparity on size tuning curves of V4 neurons. A, Schematic drawing of stimulus used in physiological experiment and time course of events. B, Size tuning curves of a sample V4 neuron that did not change its size preference for the cyclopean figure depending on binocular disparity. B, C, Vertical lines at top indicate the peak size preference derived from fitting curves in each binocular disparity condition. Bottom graphs represent the time-averaged vergence angle of the stimulus duration with respect to the prestimulus period as a function of binocular disparity of the stimulus. DoE functions were fitted to the data points obtained at different disparities. Error bars indicate SEM. C, Size tuning curves of a sample V4 neuron that varied its size preference for the cyclopean figure with changing binocular disparity. D, E, Examples of response fields on the plane of stimulus size and binocular disparity. Discharge rate is represented with the color scale shown on the right of each panel. Solid lines indicate the contour plots of the Gauss·DoE function fitted to the data points. The calculated SIs were −0.41 (D) and 2.50 (E), respectively.
