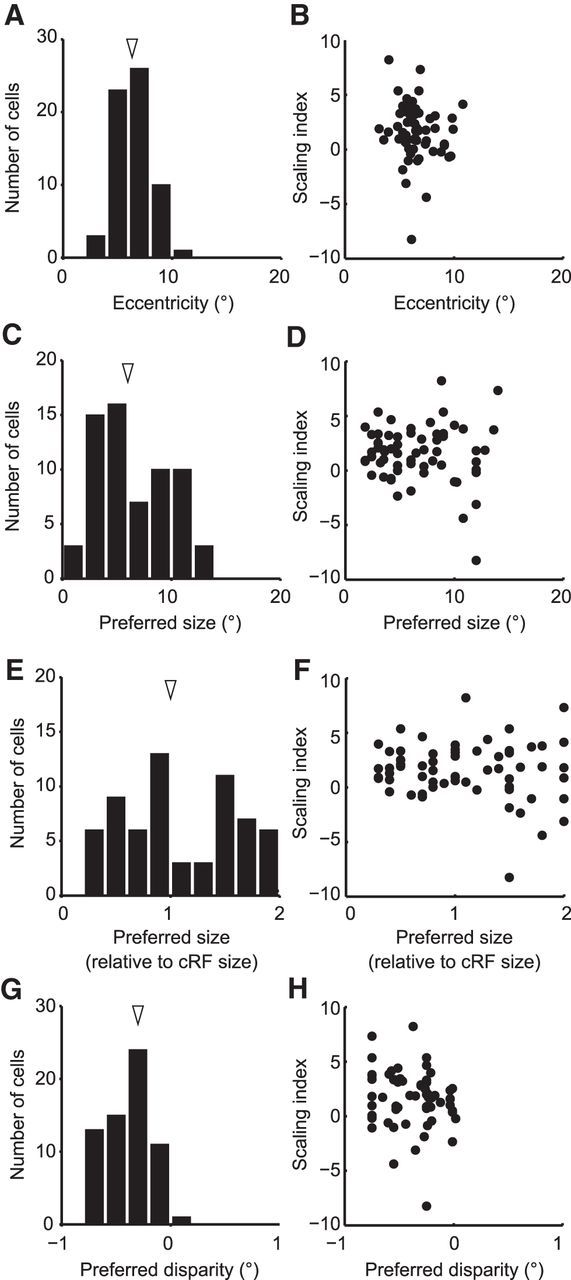
Figure 6.

Relationship between SI and other parameters of recorded neurons. A, The distribution of the RF eccentricities of recorded neurons. The median RF eccentricities were 6.3°. B, The RF eccentricities and the SIs did not show any correlation (Spearman's rank correlation, r = −0.19, p = 0.13). C, The distribution of the preferred diameter. Arrowhead indicates the median (6.7°). D, There was no correlation between SI and preferred diameter (Spearman's rank correlation, r = −0.046, p = 0.72). E, The distribution of the preferred image size relative to the diameter of the RF. Arrowhead indicates the median (1.08). F, There was no correlation between relative preferred image sizes and SIs (Spearman's rank correlation, r = −0.075, p = 0.56). G, The distribution of the preferred disparities calculated from a Gauss·DoE function fitted to the data. The distribution of preferred disparities was significantly biased toward the crossed disparities with a median of −0.30° (signed-rank test, p < 10−12). H, There was no correlation between SIs and preferred disparities (Spearman's rank correlation, r = −0.19, p = 0.14).
