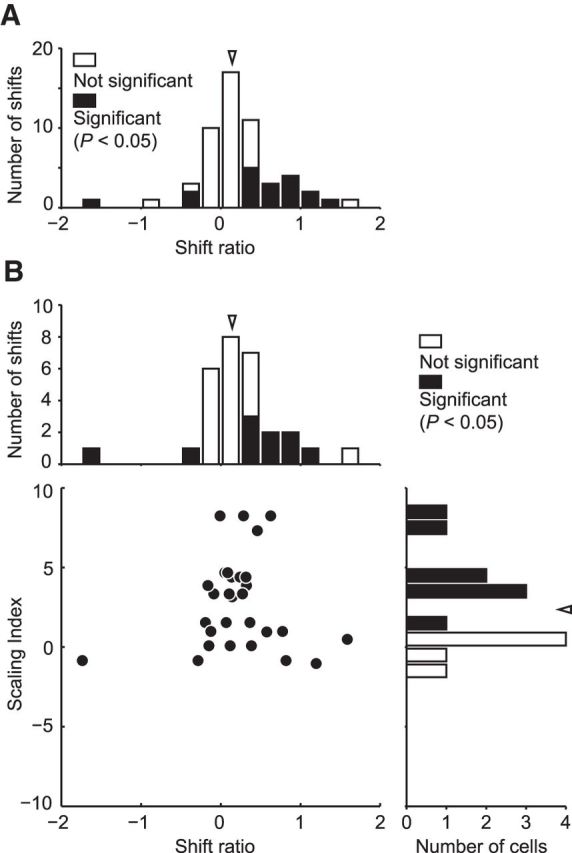
Figure 8.

Relationship between SI and relative disparity selectivity. A, The distribution of the shift ratio calculated from 54 neurons. Arrowhead indicates the median of the shift ration (0.14). Filled columns represent significant shift (sequential F test, p < 0.05). B, There was no correlation between the SI and shift ratio calculated from 14 neurons that were also selective to the size of cyclopean disks and well fitted using a Gauss·DoE function (Spearman's rank correlation, r = −0.021, p = 0.91). Top, Arrowhead indicates the median of the shift ration (0.14). Right, Arrowhead indicates the median of the SI (2.36).
