Figure 1.

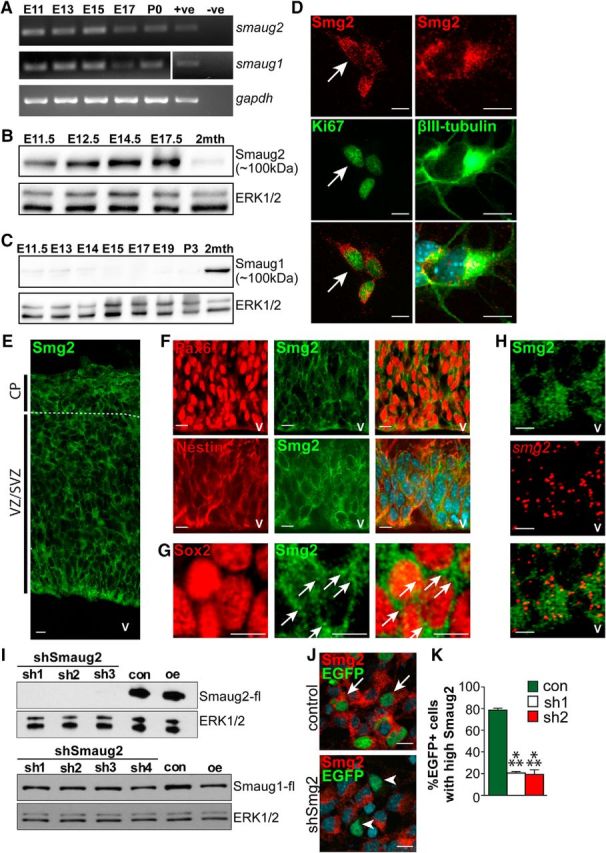
Smaug2, but not Smaug1, protein is expressed in apical precursors and newborn neurons during embryonic cortical neurogenesis. A, RT-PCR for smaug1 and smaug2 mRNAs in the developing murine cortex from embryonic days 11 to 17 (E11–E17) and at birth (P0). gapdh mRNA expression was monitored as a control. +ve, Sample with known expression of target mRNA and used as a positive control for the reaction; -ve, sample generated in the absence of reverse transcriptase. B, C, Western blots for Smaug2 (B) and Smaug1 (C) in E11.5 to 2-month-old (2mth) cortices. Blots were reprobed for ERK1/2 as a loading control. D, Images of cortical precursors isolated at E12.5, cultured for 3 d and immunostained for Smaug2 (red) and the proliferation marker Ki67 or the early neuronal marker βIII-tubulin (both green). Arrows indicate a double-labeled cell. Scale bar, 10 μm. E, Confocal image of a coronal E12.5 cortical section immunostained for Smaug2 (green). Boundaries of the VZ/SVZ and CP are denoted. v, Ventricle. Scale bar, 10 μm. F, G, Confocal images of the E12.5 cortical VZ/SVZ immunostained for Smaug2 (green) and the radial precursor marker Pax6 (F, red) or the neural precursor markers nestin (F, red) or Sox2 (G, red) at higher magnification. F, Bottom, Counterstained with Hoechst to highlight nuclei. Arrows highlight Smaug2-positive granules. Scale bars: F, 10 μm; G, 5 μm. H, Confocal images of the E12.5 cortical VZ immunostained for Smaug2 (green) and subjected to FISH for smaug2 mRNA (red). Bottom, Merge. v, Ventricle. Scale bar, 10 μm. I, Western blot analysis with anti-FLAG of HEK-293T cell lysates cotransfected with FLAG-tagged mouse Smaug2 or Smaug1 expression constructs and a control shRNA (con) or one of four different Smaug2 shRNAs (sh1, sh2, sh3, and sh4). Cells were transfected with the expression construct alone as a positive control (oe). Blots were reprobed with ERK1/2. J, Images of cultured precursors cotransfected with a nuclear EGFP construct and a control shRNA (top) or Smaug2 shRNA #2 (bottom, shSmg2), and immunostained 3 d later for Smaug2 (red) and EGFP (green). Arrows and arrowheads indicate EGFP-positive, Smaug2 positive cells and EGFP-positive, Smaug2-negative cells, respectively. Scale bar, 10 μm. K, Quantification of transfected precursors as shown in J transfected with Smaug2 shRNA1 or shRNA2 (sh1 or sh2) and analyzed for their relative levels of immunodetectable Smaug2. ***p < 0.001. n = 3 experiments. K, Statistics were performed with ANOVA and Tukey's post hoc multiple comparisons test. Error bars indicate SEM.
