
Figure 2.
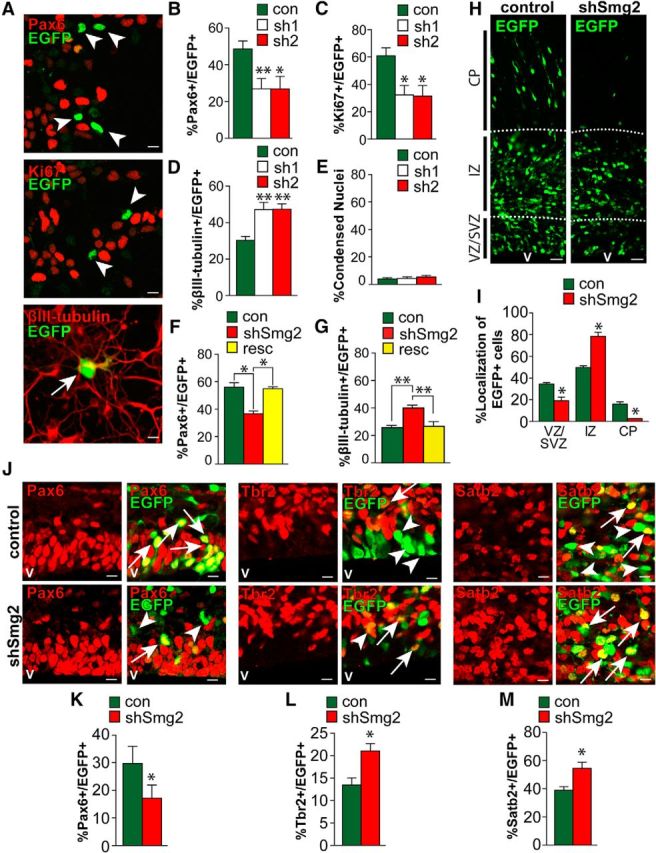
Smaug2 knockdown in culture and in vivo increases neurogenesis and depletes cycling precursors. A–E, Cultured cortical precursors were cotransfected with a nuclear EGFP construct and a control shRNA (con) or one of two Smaug2 shRNAs (sh1 and sh2), and analyzed by immunostaining 3 d later. A, Images of precursors transfected with Smaug2 shRNA #1 and immunostained for EGFP (green) and Pax6, Ki67, or βIII-tubulin (all red). Arrows and arrowheads indicate EGFP-positive, marker-positive cells and EGFP-positive, marker-negative cells, respectively. Scale bar, 10 μm. B–D, Quantification of cultures as in A for the percentage of EGFP-positive cells expressing Pax6 (B), Ki67 (C), or βIII-tubulin (D). *p < 0.05. **p < 0.01. n = 3 experiments. E, Quantification of condensed nuclei to assess cell death in cultures as in A. F, G, Cultured precursors were cotransfected with a nuclear EGFP construct and a control shRNA (con) or Smaug2 shRNA #2 (shSmg2) with or without an expression vector encoding an shRNA-resistant human Smaug2 (resc). Three days later, cultures were immunostained and quantified for the percentage of EGFP-positive cells expressing Pax6 (F) or βIII-tubulin (G). *p < 0.05. **p < 0.01. n = 3 experiments. H–M, E13/E14 murine cortices were coelectroporated with a nuclear EGFP construct together with control (con) or Smaug2 shRNA #2 (shSmg2), and coronal sections were analyzed 3 d later at E16/E17. H, Confocal images of electroporated cortices immunostained for EGFP (green). v, Ventricle. Scale bar, 30 μm. I, Quantification of sections as in H for the percentage of EGFP-positive cells located in the different cortical regions. *p < 0.05. n = 3 embryos each, at least 3 sections per embryo. J, Confocal images of the VZ/SVZ of electroporated sections immunostained for EGFP (green) and Pax6, the intermediate progenitor marker Tbr2, or the neuronal marker Satb2 (all red). Arrows indicate double-labeled cells. Arrowheads indicate EGFP-positive, marker-negative cells. Scale bar, 10 μm. K–M, Quantification of sections as in J for the percentage of EGFP-positive cells expressing Pax6 (K), Tbr2 (L), or Satb2 (M). *p < 0.05. n = 3 embryos each, at least 3 sections per embryo. B–G, Statistics were performed with ANOVA and Tukey's post hoc multiple comparisons test. I–M, Statistics were performed with Student's t test. Error bars indicate SEM.