
Figure 4.
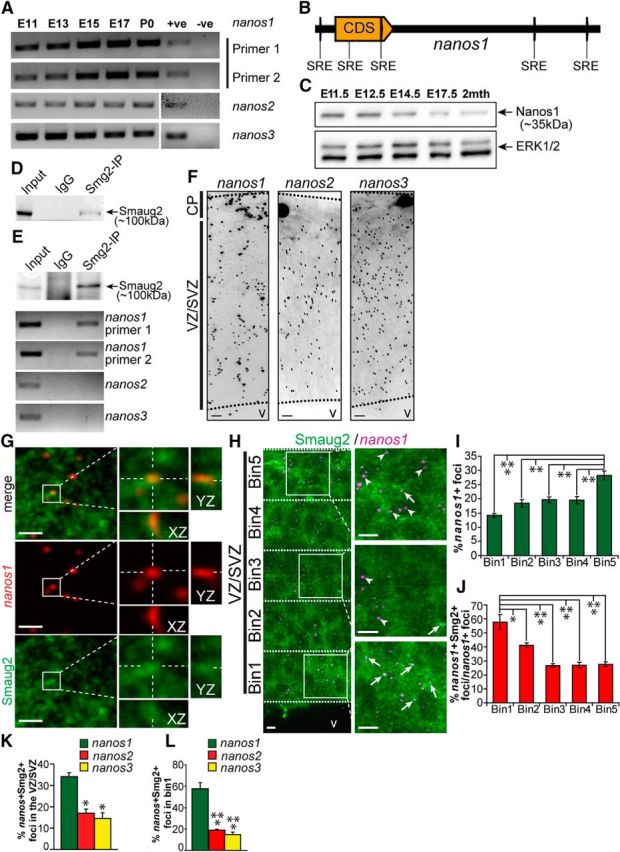
nanos1 mRNA is a Smaug2 target in embryonic cortical precursors. A, RT-PCR for nanos1, nanos2, and nanos3 mRNAs in murine cortices from E11 to birth (P0). nanos1 mRNA expression was detected using two different primer sets. PCR products were sequenced to confirm specificity. +ve, Sample with known expression of target mRNA and used as a positive control for the reaction; -ve, sample generated in the absence of reverse transcriptase. B, Schematic of SREs in the nanos1 mRNA transcript. Yellow arrow labeled CDS represents the protein-coding region. C, Western blot analysis for Nanos1 in E11.5 to 2-month-old cortices. The blot was reprobed for ERK1/2 as a loading control. D, Western blot of HEK-293T cells transfected with a Flag-tagged mouse Smaug2 construct and immunoprecipitated with anti-Smaug2 or with control nonspecific rabbit IgG, probed with antibodies for Smaug2. As a control, 10% of the input homogenate was loaded. E, Western blot (top) of E12.5 cortical lysates immunoprecipitated with the same Smaug2 antibody as in D or with control, nonspecific rabbit IgG and probed with anti-Smaug2. As a positive control, 10% of the input homogenate was loaded. Similar immunoprecipitates were generated in parallel, mRNA was extracted, and the samples were analyzed for nanos1, nanos2, and nanos3 mRNAs using RT-PCR (second to bottom panels). F, Confocal images of FISH for nanos1 (left), nanos2 (center), and nanos3 (right) mRNAs (black granules) in coronal sections of the E12.5 cortex. v, Ventricle. Scale bar, 10 μm. G, Higher-magnification confocal images of the VZ/SVZ of an E13.5 cortical section showing FISH for nanos1 mRNA (red) and immunostaining for Smaug2 (green). Top, Merge. Boxed regions are shown at higher magnification in the right panels, which also show colocalization of Smaug2 and nanos1 mRNA on the z-axis (XZ and YZ), as indicated by the hatched white lines. Scale bar, 10 μm. H, Confocal images of the E12.5 cortex showing FISH for nanos1 mRNA (magenta) and immunostaining for Smaug2 (green). The VZ/SVZ is divided into five bins of identical width, as denoted by the hatched white lines, and boxed regions within some of these bins are shown at higher magnification in the right panels. Arrows indicate foci with colocalized nanos1 mRNA and Smaug2. Arrowheads indicate foci with only nanos1 mRNA. v, Ventricle. Scale bar, 10 μm. I, J, Quantification of sections similar to that shown in H for the distribution of total nanos1 mRNA-positive foci (I) and the relative proportion of nanos1 mRNA-positive foci that colocalize with Smaug2 in each bin (J). *p < 0.05. **p < 0.01. ***p < 0.001. n = 3. K, L, Quantification of sections similar to those shown in H for the proportion of nanos1, nanos2, or nanos3 mRNA foci that colocalize with Smaug2 across the entire E12.5 VZ/SVZ (K) or only in Bin1 (L), the apical-most region of the VZ. *p < 0.05. ***p < 0.001. n = 3. Statistics were performed with ANOVA and Tukey's post hoc multiple comparisons test. Error bars indicate SEM.