
Figure 7.
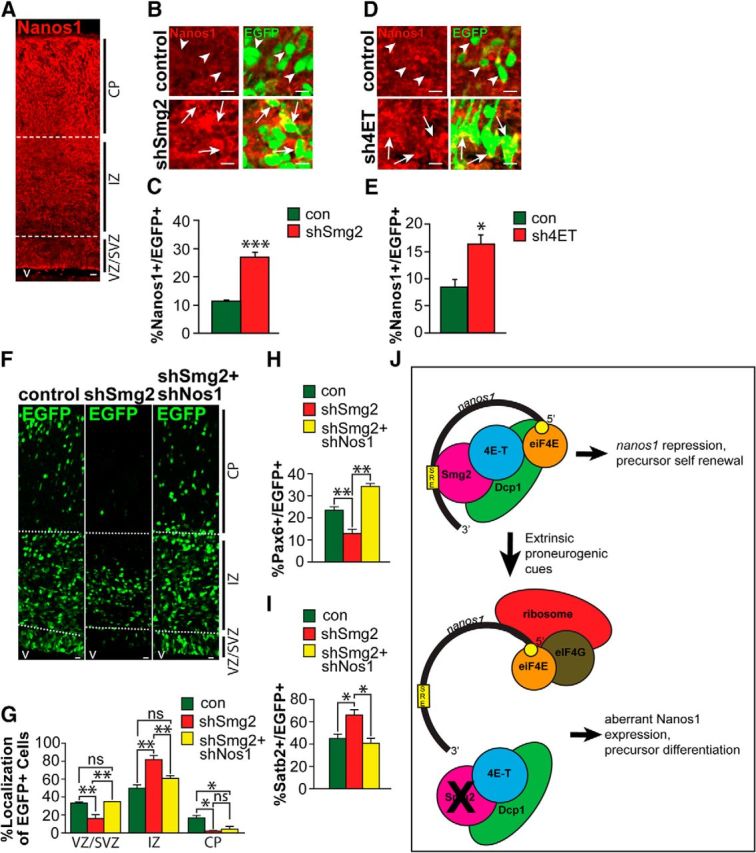
Knockdown of Smaug2 or 4E-T causes aberrant Nanos1 expression, and this is responsible for the Smaug2 knockdown-mediated increase in neurogenesis. A, Nanos1 immunoreactivity in a coronal section of the E16/E17 cortex. v, Ventricle. Scale bar, 10 μm. B, Confocal images of cells at the border of the SVZ and the IZ of E16/E17 murine cortices that were coelectroporated 3 d earlier with a nuclear EGFP construct and control (con) or Smaug2 (shSmg2) shRNAs. Sections were immunostained for EGFP (green) and Nanos1 (red). Arrows and arrowheads indicate EGFP-positive cells that do or do not express Nanos1, respectively. Scale bar, 10 μm. C, Quantification of the proportion of EGFP-positive cells expressing detectable Nanos1 in sections similar to those in B. ***p < 0.001. n = 3 embryos each, at least 3 sections per embryo. D, Confocal images of cells at the border of the SVZ and the IZ of E15/E16 murine cortices that were coelectroporated 2 d earlier with a nuclear EGFP construct and control (con) or 4E-T (sh4ET) shRNAs. Sections were immunostained for EGFP (green) and Nanos1 (red). Arrows and arrowheads indicate EGFP-positive cells that do or do not express Nanos1, respectively. Scale bar, 10 μm. E, Quantification of the proportion of EGFP-positive cells expressing detectable Nanos1 in sections similar to those in D. *p < 0.05. n = 3 embryos each, at least 3 sections per embryo. F–I, E13/E14 cortices were coelectroporated with a nuclear EGFP construct and control (con) or Smaug2 shRNA (shSmg2) ± Nanos1 shRNA (shNos1), and coronal cortical sections were analyzed 3 d later at E16/E17. F, Images of electroporated sections immunostained for EGFP (green). v, Ventricle. Scale bar, 10 μm. G, Quantification of sections similar to those in F for the percentage of EGFP-positive cells located in the different cortical regions. *p < 0.05. **p < 0.01. ns, Nonsignificant. n = 3 embryos each, at least 3 sections per embryo. H, I, Quantification of EGFP-positive, marker-positive cells in sections as in F immunostained for EGFP and either Pax6 (H) or Satb2 (I). *p < 0.05. **p < 0.01. n = 3 embryos each, at least 3 sections per embryo. J, Schematic showing the proposed repressive complex involving Smg2, 4E-T, Dcp1, and nanos1 mRNA (top). When the complex is disrupted, either by environmental signals or by knockdown of complex components such as Smaug2, this causes aberrant translation of Nanos1, thereby promoting neurogenesis (bottom). G–I, Statistics were performed with ANOVA and Tukey's post hoc multiple comparisons test. Other panels, Statistics were performed with Student's t test. Error bars indicate SEM.