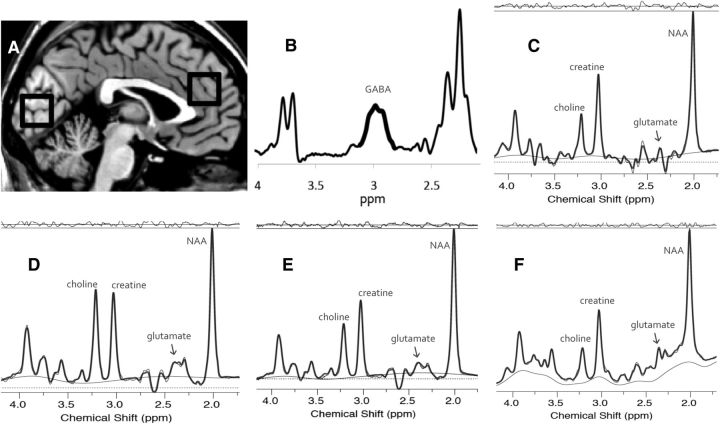
Figure 1.
A, The location of the visual cortex and anterior cingulate cortex voxels. B, The difference spectrum from a MEGA-PRESS GABA editing sequence acquired from the visual cortex. The thicker line segment indicates the frequency range used for peak integration of the GABA signal. C, The LCModel fit of an off-resonance spectrum from a MEGA-PRESS GABA editing sequence acquired from the visual cortex and used to calculate the glutamate signal in Study 1. D, The LCModel fit of a PRESS acquisition from the anterior cingulate cortex with TE = 144 ms. E, The LCModel fit of a PRESS acquisition from the visual cortex with TE = 144 ms. F, The LCModel fit of a PRESS acquisition from the visual cortex with TE = 30 ms. For C through F, the model fit (heavy line) is superimposed on the raw spectral data (fine line) above the estimated baseline (fine undulating line). The raw data line is extensively overlapped by the fit line, but is discernable at some parts per million values (e.g., above the fit line at ∼2.7 ppm and below the fit line at ∼2.5 ppm in D). The residual (fit − raw data) is shown at the top of each panel.

