
Figure 2.
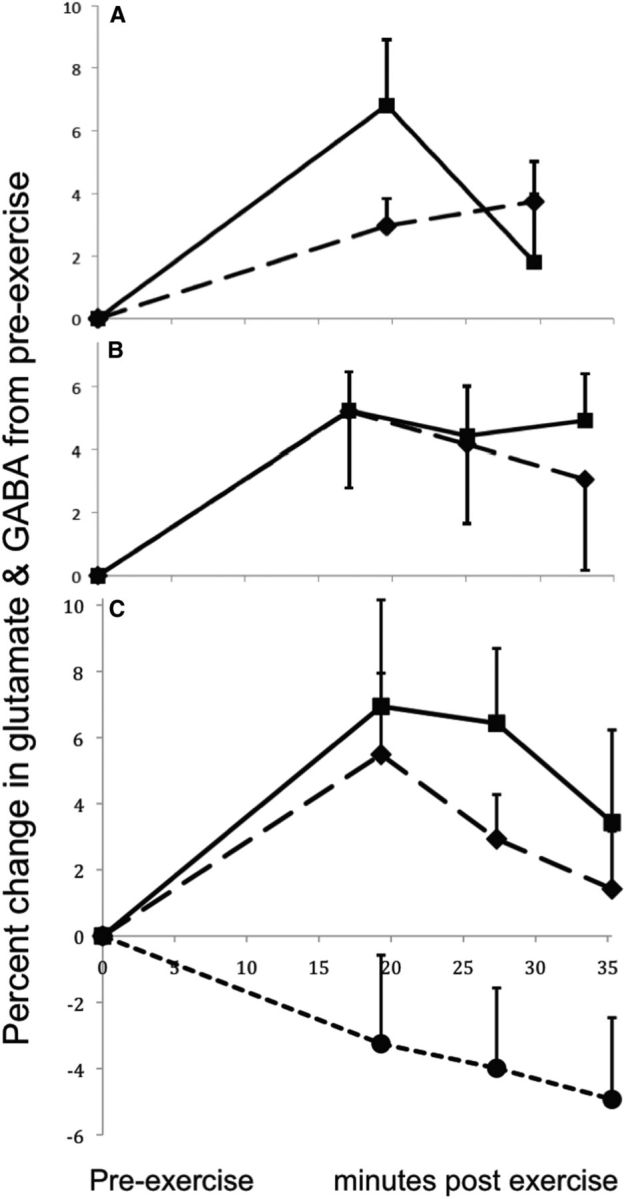
The mean and SEM of the percentage change in GABA/creatine or glutamate/creatine ratio from the baseline to the postexercise measurements. A, The percentage change in GABA/creatine (solid) and glutamate/creatine (dashed) ratios measured in the visual cortex with a MEGA-PRESS editing sequence in Study 1 (N = 8). B, The percentage change in glutamate/creatine ratio measured in the anterior cingulate cortex (solid; N = 8) and the visual cortex (dashed; N = 8) at TE = 144 ms in Study 2. C, The percentage change in glutamate/creatine ratio measured in the visual cortex in eight subjects at TE = 30 ms (solid line) and TE = 144 ms (long dashes; Study 3). Also shown is the percentage change in glutamate/creatine ratio measured in the visual cortex in six sedentary control subjects (short dashes) at TE = 144 ms in the Control Study. These subjects followed all procedures as in Studies 2 and 3, but did not exercise.