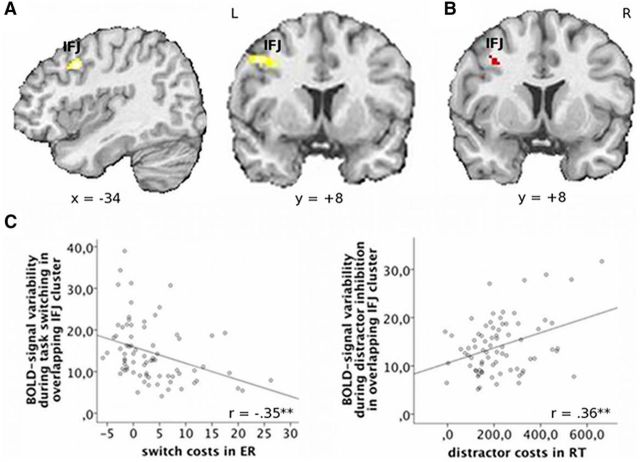
Figure 3.
Positive relationship between RT costs and BOLD-signal variability during distractor inhibition and antagonistic relation between performance and BOLD-signal variability in left IFJ. A, Positive correlation between RT costs and condition-specific BOLD-signal variability during distractor inhibition, p < 0.05 (corrected). B, Conjunction in left IJF (k = 8 voxel) between (1) negative correlation of task-switching costs in error rates with BOLD-signal variability, as shown in Figure 2B and (2) positive correlation of distractor inhibition costs in RT and BOLD-signal variability. C, Scatter plots illustrating the antagonistic relationship between BOLD-signal variability and behavior for task switching (left) and distractor inhibition (right) in the overlapping part of the IFJ (note that, after exclusion of one multivariate outlier as detected by Mahalanobis distance, the result for distractor inhibition was still significant with r = 0.26, p = 0.02). **p < 0.01. ER, Error rate.

