Figure 3.

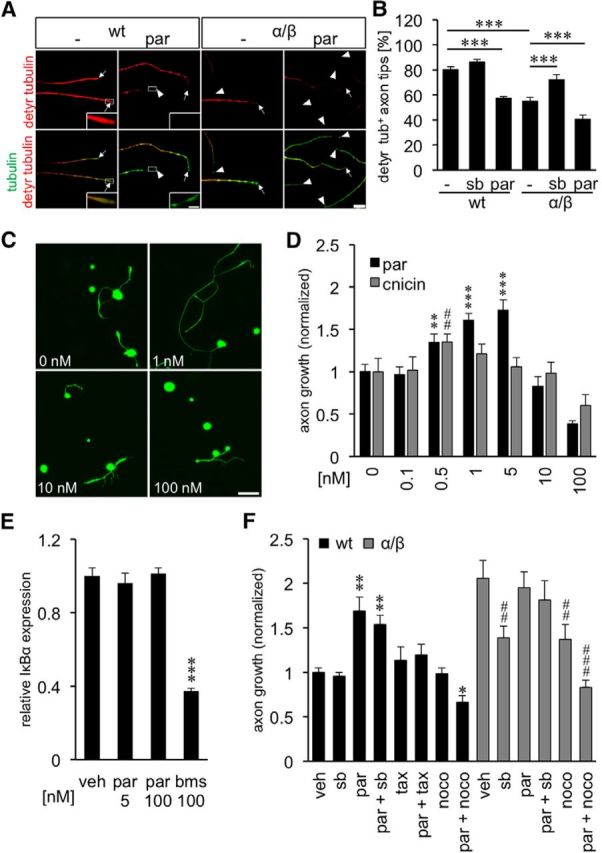
Inhibition of tubulin detyrosination promotes axon growth. A, Representative pictures of axons in DRG cultures from wt and GSK3αS/A/GSK3βS/A (α/β) mice exposed to either vehicle (−) or 5 nm parthenolide (par). Axons were stained for detyrosinated tubulin (detyr. tubulin, red) and βIII-tubulin (tubulin, green). Arrows indicate axon tips, arrowheads axon tips without detyrosinated tubulin. Scale bar, 20 μm. Insets, Magnified examples of detyrosinated tubulin-positive and -negative axon tips. Scale bar, 5 μm. B, Quantification of axon tips with detyrosinated tubulin in cultures from wt and α/β mice 3 d after exposure to vehicle (−), 5 μm SB216763 (sb), or 5 nm parthenolide (par). Data were normalized to wt controls and represent mean ± SEM of three independent experiments. Treatment effects: ***p ≤ 0.001. GSK3S/A as well as par treatment reduced the levels of detyrosinated tubulin in axonal tips. C, Representative pictures of dissociated wt DRG neurons treated with various par concentrations and stained for βIII-tubulin after 2 d in culture. Scale bar, 100 μm. D, Quantification of axon growth in wt DRG cultures after treatment with various cnicin and par concentrations. Data from treated neurons were normalized to vehicle controls with an average axon length of 933 μm/neuron for parthenolide and 546 μm/neuron for cnicin. Data represent mean ± SEM of three independent experiments. Treatment effects compared with vehicle control: **p ≤ 0.01; ***p ≤ 0.001; ##p ≤ 0.01; E, Quantitative PCR: relative expression of NFκB inhibitor α (IκBα) in dissociated DRG treated with DMSO (veh), 5 and 100 nm parthenolide (par), or 100 nm NFκB inhibitor BMS 345541 (bms), respectively. Data represent mean ΔΔCt ± SEM of two independent experiments. Treatment effect: ***p ≤ 0.001. NFκB activity was not affected at the concentrations of parthenolide used in our culture conditions. F, Quantification of axon growth in DRG cultures from wt or GSK3αS/A/GSK3βS/A mice (α/β), treated with vehicle (veh), 5 μm GSK3 inhibitor SB216763 (sb), 1 nm par, 10 nm paclitaxel (tax), 10 nm tax + 1 nm par, 5 μm sb + 1 nm par, 10 nm nocodazole (noco), or 1 nm par + 10 nm noco after 2 d in culture. Data from treated neurons were normalized to vehicle controls with an average axon length of 842 μm/neuron and represent mean ± SEM of three independent experiments. Treatment effects compared with vehicle-treated wt neurons: *p ≤ 0.05; **p ≤ 0.01. Treatment effects compared with vehicle-treated α/β neurons: ##p ≤ 0.01; ###p ≤ 0.001.
