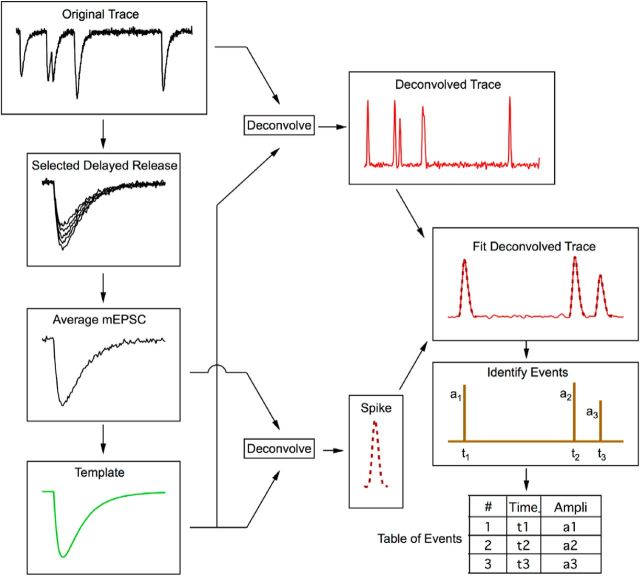
Figure 1.
Decomposition of EPSCs. A flowchart shows the various steps involved in the decomposition of EPSCs. Starting from a response trace to a train of stimuli, individual EPSCs are selected during delayed release. After alignment, these EPSCs are averaged together, building the mEPSC average, and they are then fitted with a multiexponential curve, the template. Using the template, deconvolution is applied both to the original trace and to the mEPSC average, producing a deconvolved trace containing a series of spikes in the first case and a single spike in the second case. After fitting the deconvolved trace with appropriately scaled spikes, a series of events are identified. Finally, a table is produced listing each event together with its occurrence time and amplitude.

