Figure 2.
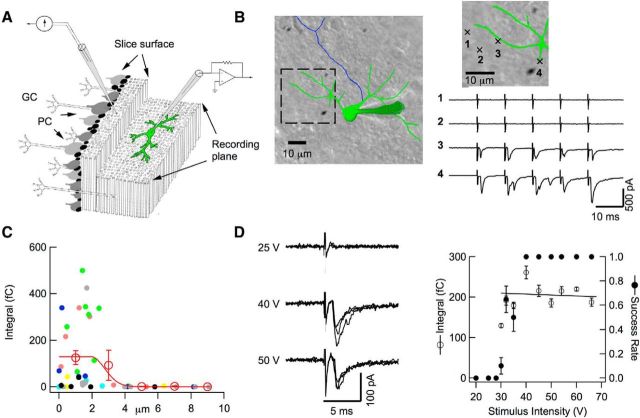
Local stimulation of PF–MLI connections. A, Schematics of recording conditions. In a parasagittal slice, the dendritic arborization of a recorded MLI is parallel to the slice surface (left, granule cell layer; right, molecular layer), whereas PFs are orthogonal to the MLI plane. GC, Granule cell; PC, Purkinje cells. A θ-glass pipette is positioned on top of the MLI arborization on the slice surface to stimulate presynaptic PFs. B, Representative experiment comparing the responsiveness of 4 presynaptic pipette positions located at the slice surface (green: somatodendritic domain and recording pipette; blue: axon; stimulation positions shown in enlarged image), with 2 responsive positions directly above the dendritic arborization and 2 other positions outside of the arborization (5 stimuli, 100 Hz; same stimulus conditions for all positions: 0.1 ms duration, 31 V amplitude). C, Group results from seven experiments as in B, where results from individual cells are color coded, showing a sharp drop of responsiveness (calculated as the mean EPSC integral for the first response) as a function of distance to the nearest dendrite. In each experiment, the stimulation intensity was adjusted such that at least one dendritic site would respond, and was then kept constant for all positions of the stimulation pipette. Open circles and associated error bars show binned averages ± SEM. The results are fitted with a constant (over a distance of 1.9 μm) followed with a half-Gaussian decay with an SD of 0.8 μm, so that responsive spots were located within a distance to the nearest dendrite of 1.9 + 0.8 = 2.7 μm. D, Intensity-response curve of a potential simple synapse. Left, Representative traces obtained with 3 stimulation intensities (stimulation duration: 0.1 ms; 3 superimposed traces at each intensity). Right, By careful selection of the presynaptic pipette position, it is possible to obtain a step-like intensity-response curve (dots: mean success probability for first stimulation; circles: mean current integral for successful first stimulations; error bars indicate ± SEM; n = 10–20 trials for each intensity) with a narrow transition region (here, at 30–35 V). A regression line through the first stimulation integral data points fails to reveal any significant relation to stimulation intensity. Such results are consistent with single PF stimulation. For simple synapse recording, stimulation intensity is set just above threshold (near 40–45 V in this example).

