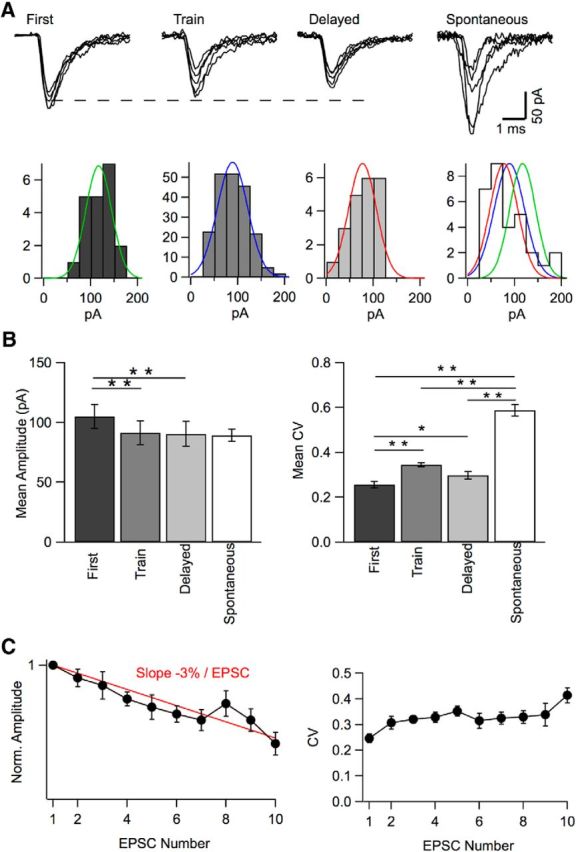
Figure 8.

Mean and CV of peak amplitudes in simple synapse experiments. A, Representative superimposed EPSCs from a simple synapse experiment illustrating first events, showing large and homogeneous amplitudes; train events, showing more heterogeneous, somewhat smaller amplitudes (reflecting receptor activation and desensitization from previous events); delayed-release events, also with smaller amplitudes (reflecting cumulative desensitization). Right, Spontaneous events (from another recording), with very heterogeneous amplitudes (reflecting mixed contributions from several synapses; mean: 86 pA, CV: 0.50). Amplitude histograms with Gaussian fits are shown below each set of traces (right: with superimposed normalized Gaussian fits of first, train, and delayed traces). Respective mean and CV values: 117 pA, 0.23 (green); 89 pA, 0.36 (blue); 77 pA, 0.40 (red). B, Group data from 24 simple synapse experiments showing mean and CV of peak amplitudes for first events (after exclusion of presumed double events, following the criterion of Fig. 5), train events (after correction for amplitude occlusion from previous events), and delayed events. Data for spontaneous events are also shown for comparison (n = 13). First events display larger mean amplitude than train events or delayed events (p < 0.001 in each case). They also display a lower CV than train events (p < 0.001) and delayed events (p < 0.05). Spontaneous events have a mean that is not different from that of first events, train events, or delayed events. However, they have a CV that is larger than that of first, train, or delayed events (p < 0.001 in each case). C, Plot of EPSC amplitudes (left) and CV (right) as a function of their order of appearance in each trace. Results were corrected as in Figure 6. They were normalized in each experiment with respect to the amplitude of the first EPSC and were averaged across 11 experiments performed at 200 Hz stimulation. The amplitude plot shows a continuous decline and can be fitted with a line having a slope of 3% per EPSC (red). The CV increases from the first to the second EPSC and stabilizes thereafter.
