
Figure 6.
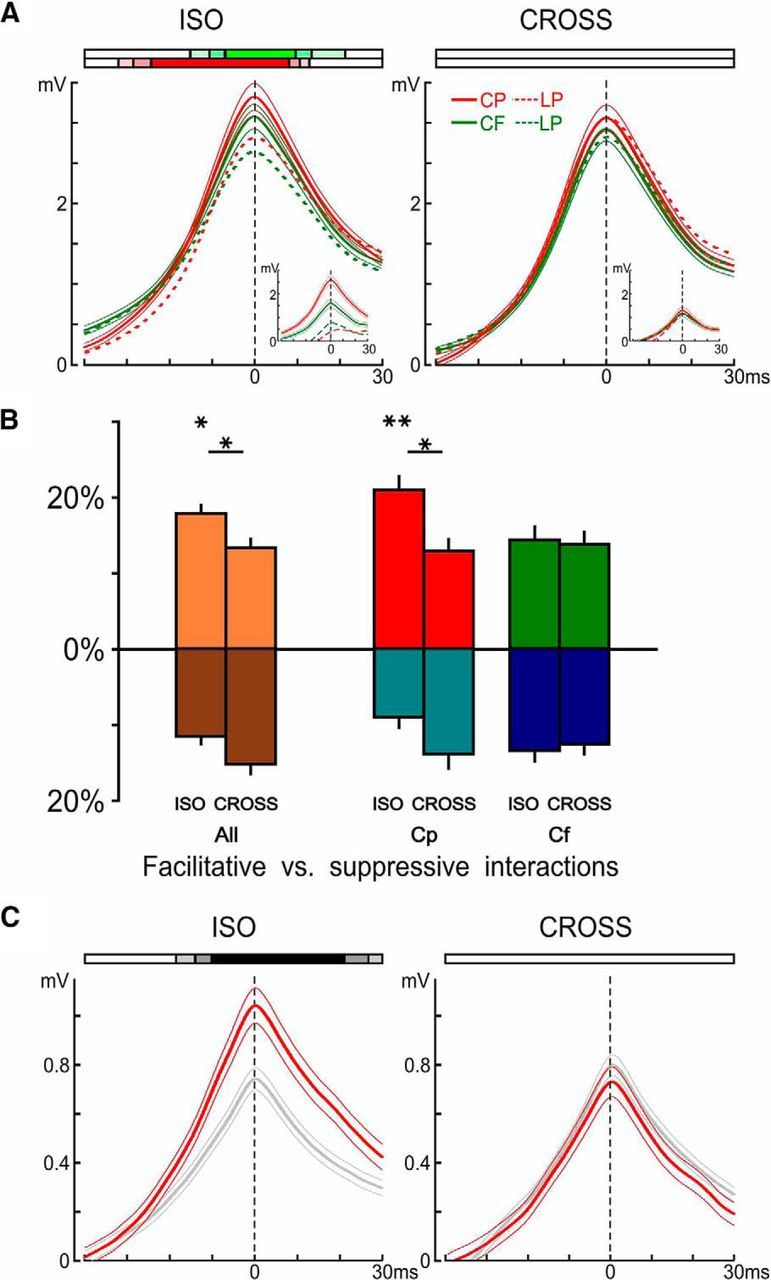
Nonlinearities in the dynamic association field (D-AF). A, Peripeak response waveforms, averaged across all cells and significant responses (see Materials and Methods), grouped by configuration (ISO, left; and CROSS, right) and trajectory type (centripetal, red; and centrifugal, green). Average response to centripetal and centrifugal is shown as mean ± SEM (n = 462 for centripetal ISO, n = 463 for centrifugal ISO, n = 388 for centripetal CROSS, and n = 412 for centrifugal CROSS). Ribbons at the top represent when the average response was significantly higher than its LP at a given significance level (color coding for three levels p < 0.05, p < 0.01, and p < 0.001 depicted by the fully saturated color, one-tailed paired permutation test). Insets, Same analysis but restricting the averages to the pairs of nodes where the response to the centripetal ISO trajectory was significantly bigger than its LP (n = 140). Even when the centripetal ISO trajectory elicits supralinear summation, the corresponding centripetal CROSS trajectory did not, on average. B, Proportion of statistically significant evoked nonlinear interactions (in %). For each cell, the proportions of significant (p < 0.05, one-tailed, paired permutation test) evoked facilitative, and suppressive, nonlinear interactions were computed for trajectories where the 2S-AM response or its LP is significantly above the activity during blank trials (p < 0.01, one-tailed), as in A. These proportions were then averaged across the population of cells (n = 25) and represented as mean ± SEM, along the positive y-axis for facilitatory interactions and along the negative y-axis for suppressive interactions. Top asterisks indicate, for each trajectory type, significant differences in average proportions of facilitatory versus suppressive interactions. We also tested for significant differences between the ISO and CROSS configurations (bottom asterisks). Both used two-tailed, paired permutation tests. C, Peripeak response waveforms, averaged across all cells and all peripheral centripetal trajectories, but separated by motion axis: red represents average response to trajectories along the main axis (i.e., direction 0° and 180°, n = 400 = 2 directions × 8 noncentral centripetal trajectories × 25 cells); gray represents average response to those along the two other axes (n = 800).