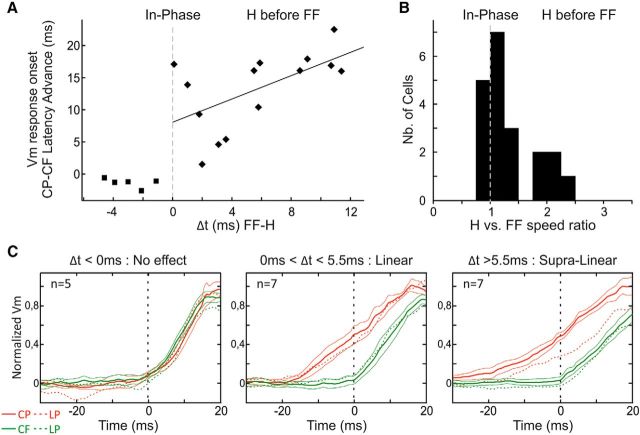
Figure 7.
Synaptic response latency advance induced by synchronizing in-phase the feedforward drive and the horizontal input. A, Scatterplot of the latency difference at half-height between synaptic responses to centripetal and centrifugal central trajectories in the ISO configuration along the main axis, as a function of the temporal lag (Δt) between feedforward drive and horizontal inputs inferred from results in Figure 4E. B, Population histogram of the ratio between the inferred horizontal propagation speed in visual space and the physical speed of the 2S-AM sequence. C, Population analysis of responses to the central trajectories along the main axis. Neurons were grouped by Δt, and their normalized responses pooled within groups using the centrifugal response as a reference. Responses are shown as mean ± SEM across cells, and their LP is illustrated as a dotted line of the same color.

