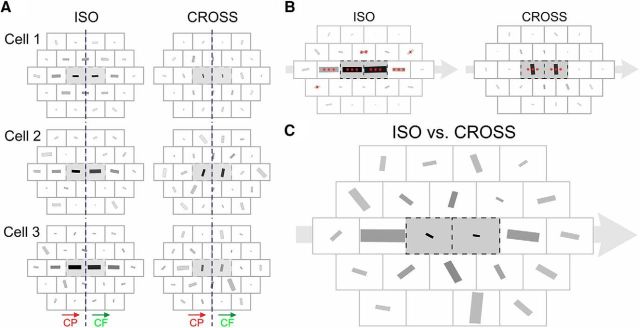
Figure 9.
The D-AF of V1 neurons. A, Examples of single-cell D-AF. The D-AFs of the three example cells of Figure 2 are represented. Left column, Preferred RF orientation for ISO trajectories. Right column, CROSS configuration. For the ISO configuration, the RF orientation giving maximal 2S responses is robustly coaligned with the radial motion flow axis for trajectories along the main axis. For the CROSS configuration, the preferred stimulus orientation differs with eccentricity from the RF center. Indeed, for trajectories toward and from the center (where one of the two Gabor patches stimulates directly the RF), the maximal response is observed when the RF orientation is orthogonal to the motion flow axis. In this case, the preferred RF orientation is that of the local Gabor inducer used for the stimulation, a result predictable from the orientation tuning in the RF center. In contrast, for more distal CROSS trajectories, such as the Cp1 on-axis trajectory, the preferred RF orientation is more variable and sometimes aligned with the motion flow axis (i.e., flipped by 90° compared with what is expected from the local feature selectivity of the RF), as in cells 2 and 3. B, Population average of individual D-AFs (n = 25). Asterisks represent the significance of the magnitude of the |R| value of the population average (i.e., where the population average of preferred RF orientations is more robust than expected by chance) (all one-tailed; see Materials and Methods). The sizes of the bars are normalized to the maximal |R| value (0.316 in this case, for the centrifugal ISO central trajectory). C, The preferred RF orientations for the ISO and the CROSS configurations are averaged vectorially for each trajectory and for each cell. These values are then averaged across the population of cells, and the net result is represented by the orientation and size of the bars. The size of each bar thus denotes whether the responses for this trajectory are more influenced by the global motion flow (size = 1) or by the local feature selectivity (here, the tuning to orientation) (size = 0). For illustration purposes, the size of the bars was normalized. The on-axis Cp1 trajectory was the most influenced by the global motion flow (|R| = 0.326).

