Figure 2.

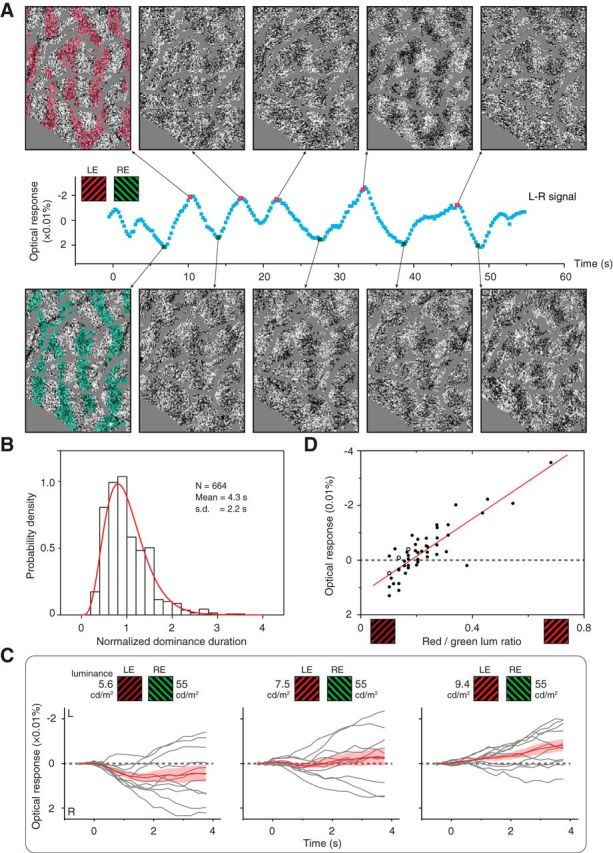
OD fluctuation and modulation. A, Single-trial frames imaged during BI stimulation exhibited complementary OD patterns in locally averaged frames (top and bottom). Red and green transparent shades are known left-eye (LE) and right-eye (RE) columns, respectively, superimposed for comparison. Each example image is an average of neighboring 3 imaging frames (0.75 s) after subtracting a baseline averaged from 49 neighboring frames (12 s). Blood vessel regions were replaced with gray color. Also see Movies 1 and 2. B, Similar to psychophysical findings (Levelt, 1967), the distribution of V1 eye dominance durations can be fit by a gamma function (red curve, R2 = 0.94). C, L–R time courses for three different binocularly incongruent conditions (right-eye biased, balanced, left-eye biased). Each condition contained 11 4 s trials (gray curves) and their mean (±SEM; red curves). D, Mean L–R values as a function of the relative stimulus strength from all cases. Each data point represents a test similar to a panel in C. Open circles are examples shown in C. Red line, Data fit with a linear function (R2 = 0.73).
